Copyright
©2014 Baishideng Publishing Group Co.
World J Gastroenterol. Jan 7, 2014; 20(1): 310-318
Published online Jan 7, 2014. doi: 10.3748/wjg.v20.i1.310
Published online Jan 7, 2014. doi: 10.3748/wjg.v20.i1.310
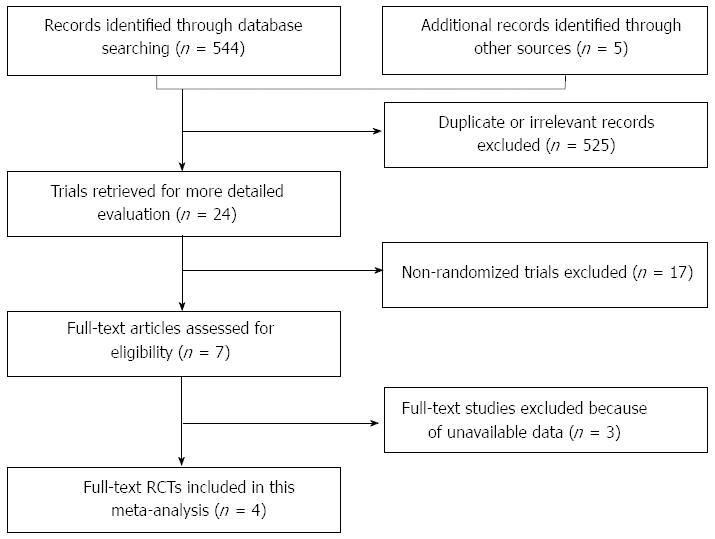
Figure 1 Flow diagram of the study selection process.
RCTs: Randomized controlled trials.
Figure 2 Standard forest plot of the HR (95%CI) for overall survival.
Values lower than 1 favor S-1-based combination therapy.
Figure 3 Standard forest plot of the HR (95%CI) for progression-free survival.
Values lower than 1 favor S-1-based combination therapy.
Figure 4 Standard forest plot of the odds ratio (95%CI) for overall response rate.
Values higher than 1 favor S-1-based combination therapy.
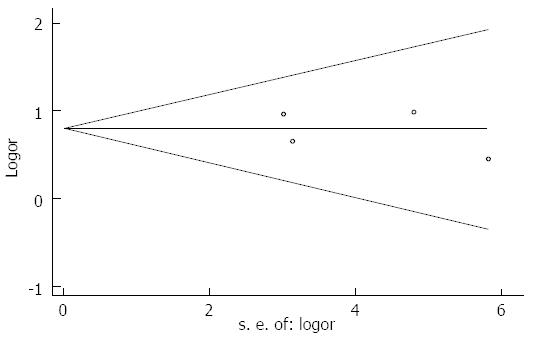
Figure 5 Funnel plot of the meta-analysis (Begg’s test).
-
Citation: Liu GF, Tang D, Li P, Wang S, Xu YX, Long AH, Zhou NL, Zhang LL, Chen J, Xiang XX. S-1-based combination therapy
vs S-1 monotherapy in advanced gastric cancer: A meta-analysis. World J Gastroenterol 2014; 20(1): 310-318 - URL: https://www.wjgnet.com/1007-9327/full/v20/i1/310.htm
- DOI: https://dx.doi.org/10.3748/wjg.v20.i1.310


