Copyright
©2014 Baishideng Publishing Group Co.
World J Gastroenterol. Jan 7, 2014; 20(1): 235-241
Published online Jan 7, 2014. doi: 10.3748/wjg.v20.i1.235
Published online Jan 7, 2014. doi: 10.3748/wjg.v20.i1.235
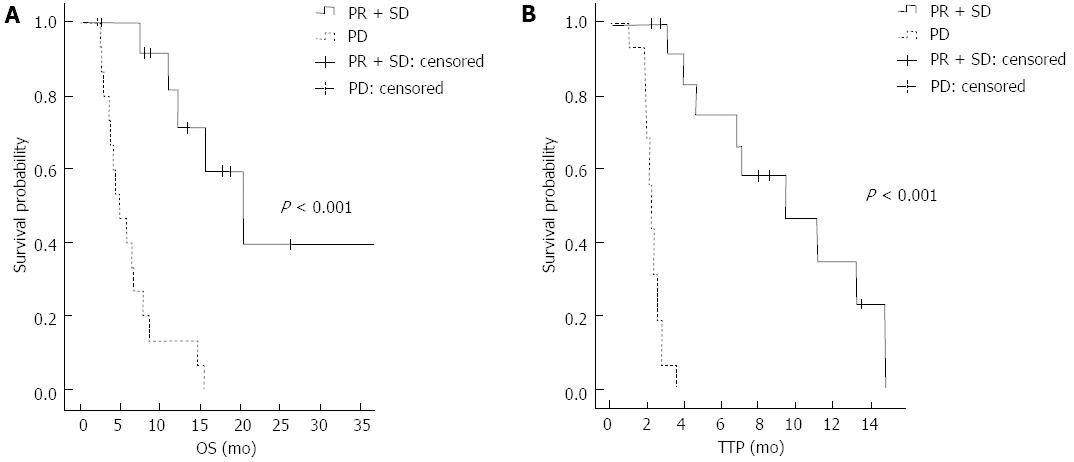
Figure 1 Survival analysis according to response to chemotherapy.
A: The group with controlled disease (PR + SD) showed longer overall survival (OS) outcome than those with progressive disease (PD): median 20.4 mo (full line) vs 4.9 mo (imaginary line); B: In time to progression (TTP), the group with controlled disease groups showed better outcome than those with progressive disease: median 9.4 mo (full line) vs 2.2 mo (imaginary line).
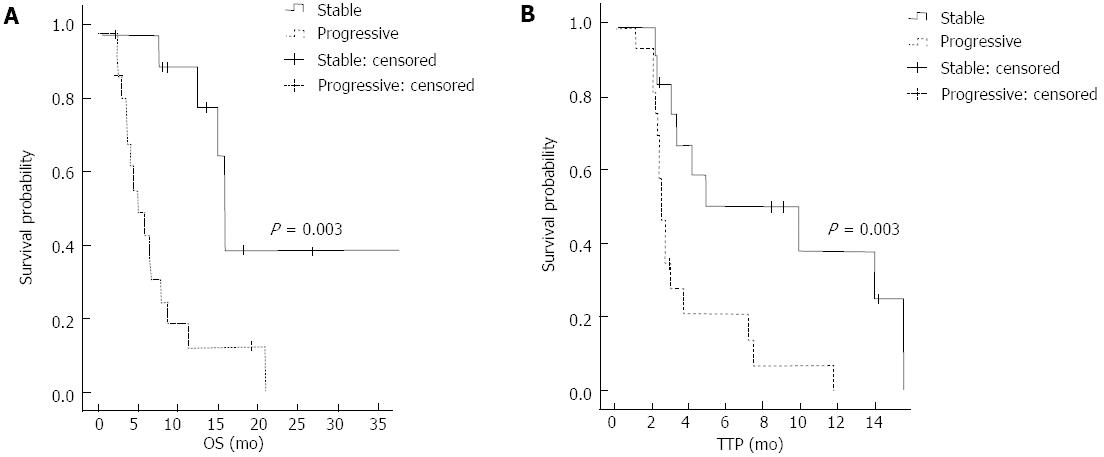
Figure 2 Survival outcomes according to status of primary liver mass.
A: The group with stable primary mass showed longer overall survival than those with progressive primary liver mass: median 13.4 mo (full line) vs 5.3 mo (imaginary line); B: In TTP, the group with stable primary mass showed better outcome than those with progressive primary liver mass: median 9.4 mo (full line) vs 2.3 mo (imaginary line). TTP: Time to progression; OS: Overall survival.
- Citation: Lee JE, Bae SH, Choi JY, Yoon SK, You YK, Lee MA. Epirubicin, Cisplatin, 5-FU combination chemotherapy in sorafenib-refractory metastatic hepatocellular carcinoma. World J Gastroenterol 2014; 20(1): 235-241
- URL: https://www.wjgnet.com/1007-9327/full/v20/i1/235.htm
- DOI: https://dx.doi.org/10.3748/wjg.v20.i1.235


