Copyright
©2014 Baishideng Publishing Group Co.
World J Gastroenterol. Jan 7, 2014; 20(1): 214-218
Published online Jan 7, 2014. doi: 10.3748/wjg.v20.i1.214
Published online Jan 7, 2014. doi: 10.3748/wjg.v20.i1.214
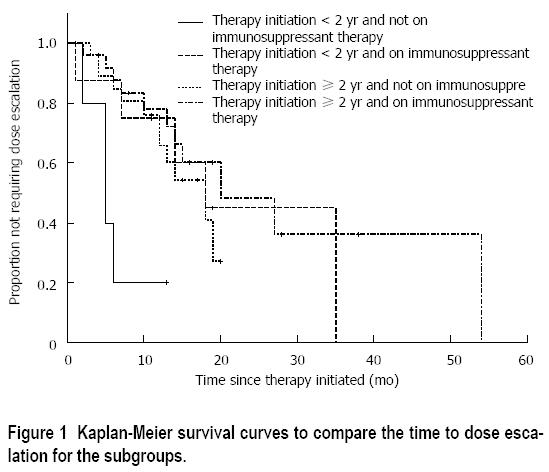
Figure 1 Kaplan-Meier survival curves to compare the time to dose escalation for the subgroups.
- Citation: Lam MC, Lee T, Atkinson K, Bressler B. Time of infliximab therapy initiation and dose escalation in Crohn’s disease. World J Gastroenterol 2014; 20(1): 214-218
- URL: https://www.wjgnet.com/1007-9327/full/v20/i1/214.htm
- DOI: https://dx.doi.org/10.3748/wjg.v20.i1.214


