Copyright
©The Author(s) 1996.
World J Gastroenterol. Dec 15, 1996; 2(4): 190-191
Published online Dec 15, 1996. doi: 10.3748/wjg.v2.i4.190
Published online Dec 15, 1996. doi: 10.3748/wjg.v2.i4.190
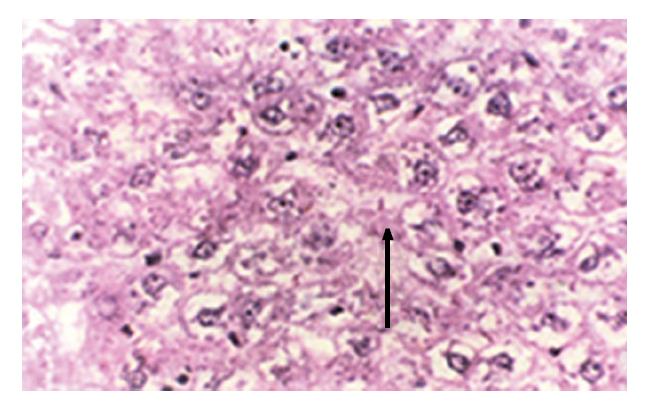
Figure 1 Cd toxic group, showing severe hydropic degeneration and sporadic lytic necrosis of the hapatic cells (× 600).
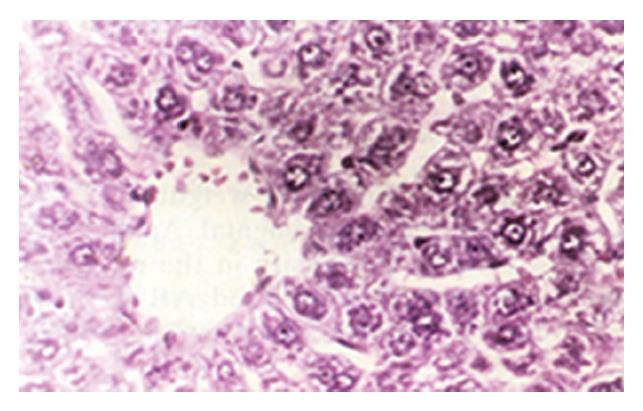
Figure 2 300 μg/mL Zn group, only showing edema of the hepatic cells (× 600).
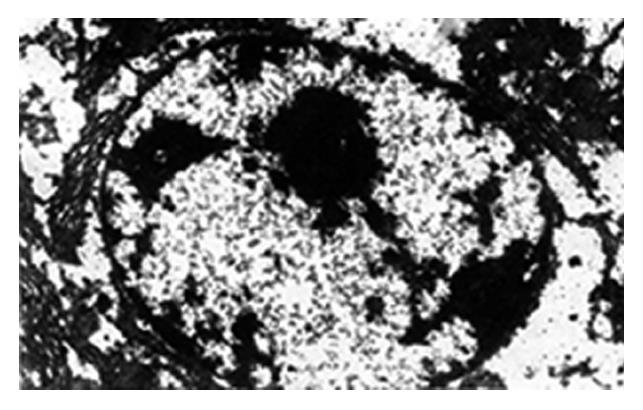
Figure 3 Cd toxic group; the hepatic cells are nearly dissolved with a lot of vacuoles, flocculent chromatin, swelling endoplasmic reticulum and degenerated mitochondria (× 8000).
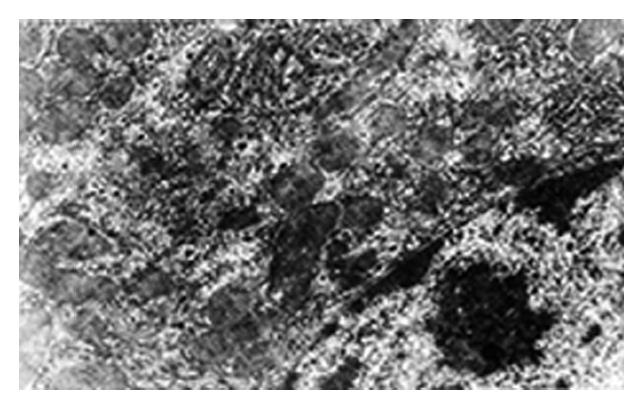
Figure 4 300 μg/mL Zn group; the karyotheca of the hepatic cell is clear and regular, the endoplasmic reticulum is nearly normal, but vacuoles are still seen in the cytoplasm (× 16000).
- Citation: Han GA, Jiang HM, Zhen XM, Zhou HJ, Xu CZ, Tian JX. Protective action of various doses of compound zinc preparation on cadmium-induced liver damage. World J Gastroenterol 1996; 2(4): 190-191
- URL: https://www.wjgnet.com/1007-9327/full/v2/i4/190.htm
- DOI: https://dx.doi.org/10.3748/wjg.v2.i4.190


