Copyright
©2013 Baishideng Publishing Group Co.
World J Gastroenterol. Feb 14, 2013; 19(6): 866-873
Published online Feb 14, 2013. doi: 10.3748/wjg.v19.i6.866
Published online Feb 14, 2013. doi: 10.3748/wjg.v19.i6.866
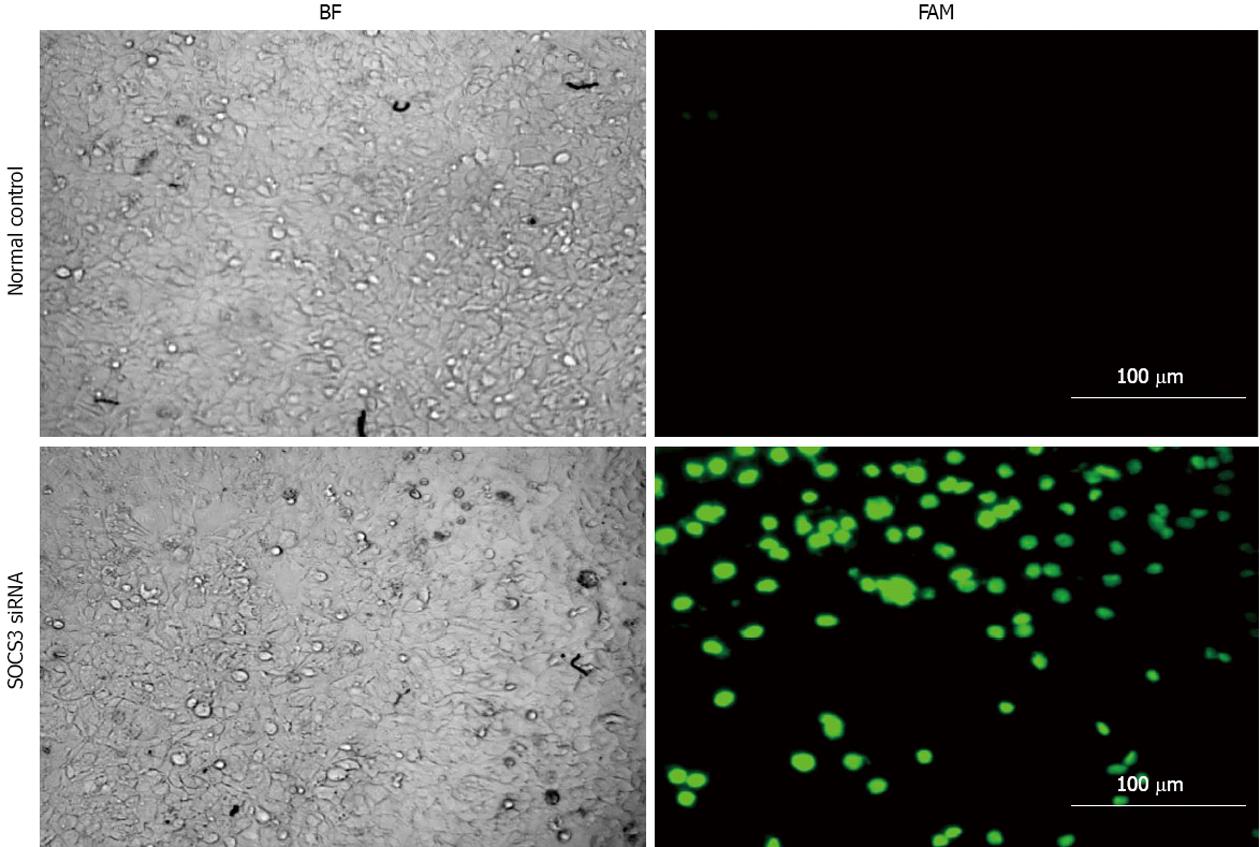
Figure 1 Fluorescent detection of transfected cells.
MHCC97H cells were transiently transfected with suppressor of cytokine signaling 3 (SOCS3) small-interfering RNA (siRNA) for 24 h, green fluorescence was observed under fluorescence microscope. BF: Bright field; FAM: Fluorescence from fluorescein-labeled scramble-siRNA.
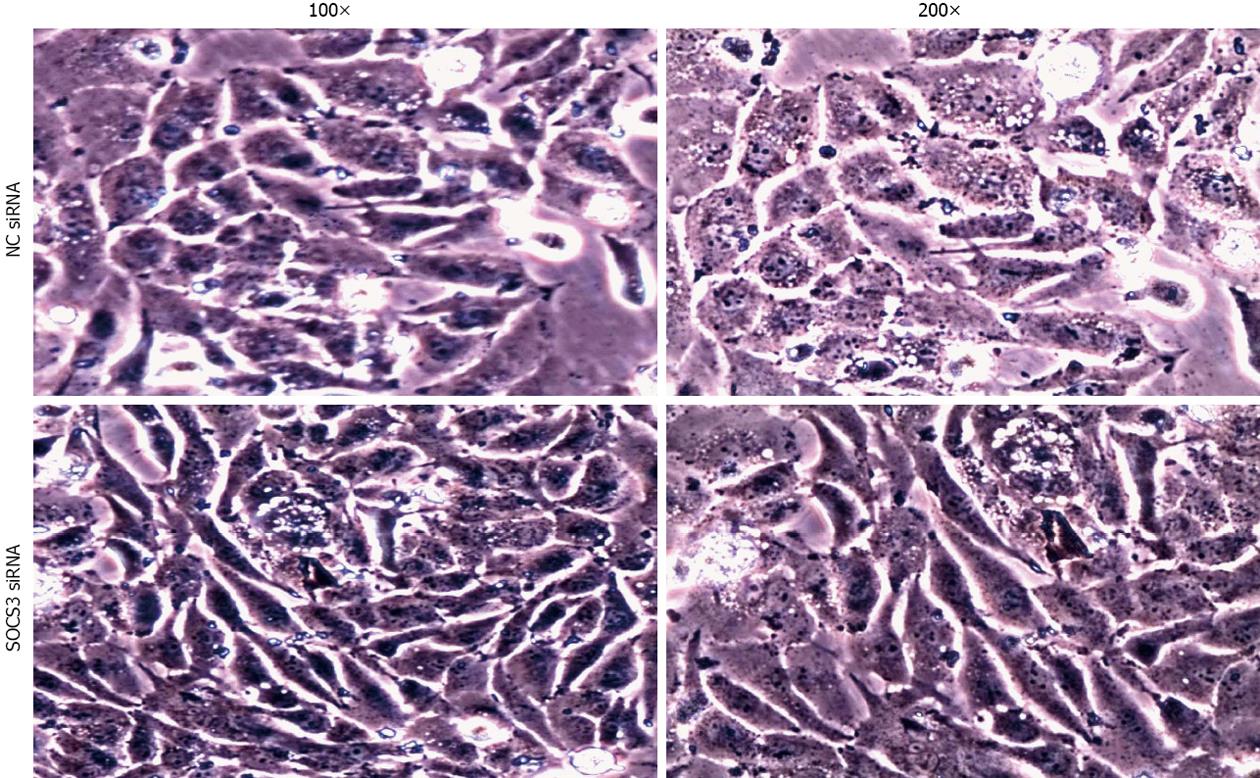
Figure 2 Effect of suppressor of cytokine signaling 3 small-interfering RNA on morphological changes of MHCC97H cells.
After application of negative control (NC) small-interfering RNA (siRNA) or suppressor of cytokine signaling 3 (SOCS3) siRNA for 48 h, morphological changes of cells were recorded with an inverted phase-contrast microscope.
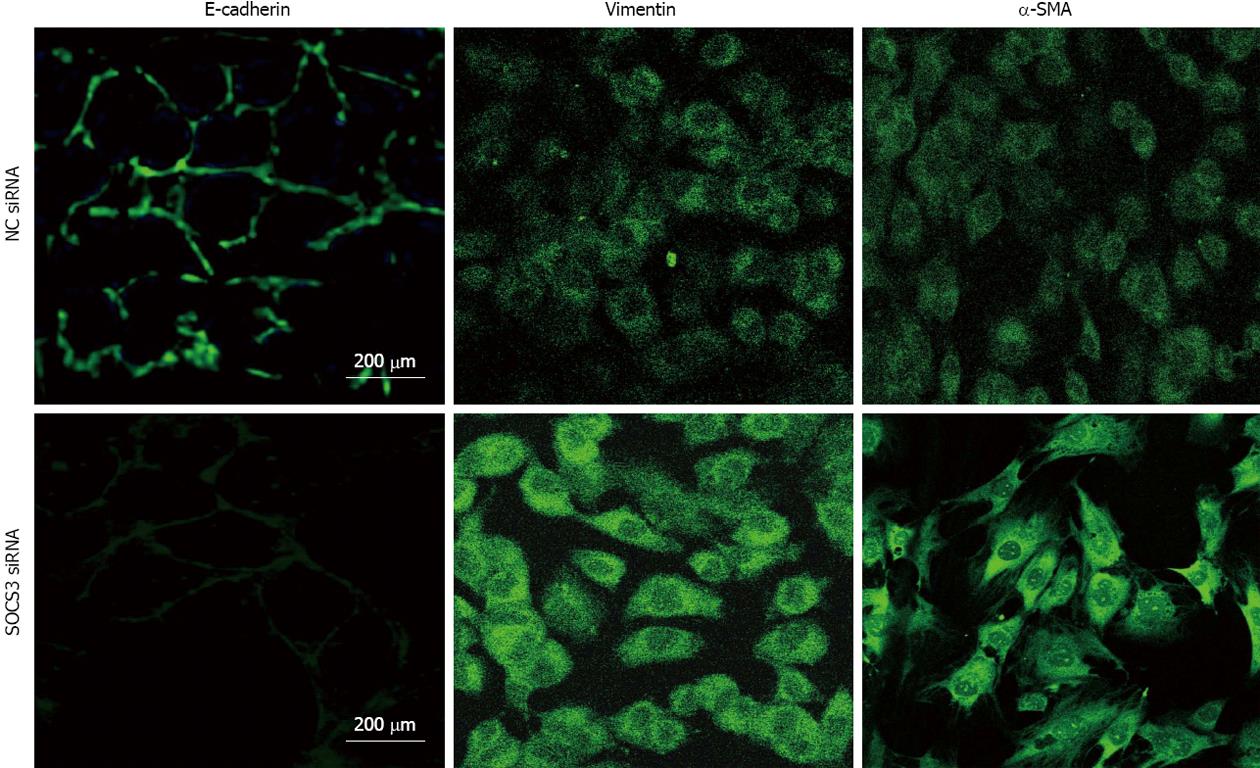
Figure 3 Effect of suppressor of cytokine signaling 3 small-interfering RNA on immunofluorescent expressions of E-cadherin, Vimentin and α-smooth muscle actin in MHCC97H cells.
The cells were transiently transfected with negative control (NC) small-interfering RNA (siRNA) or suppressor of cytokine signaling 3 (SOCS3) siRNA for 48 h, expressions of E-cadherin, Vimentin and α-smooth muscle actin (SMA) were identified with immunofluorescence.
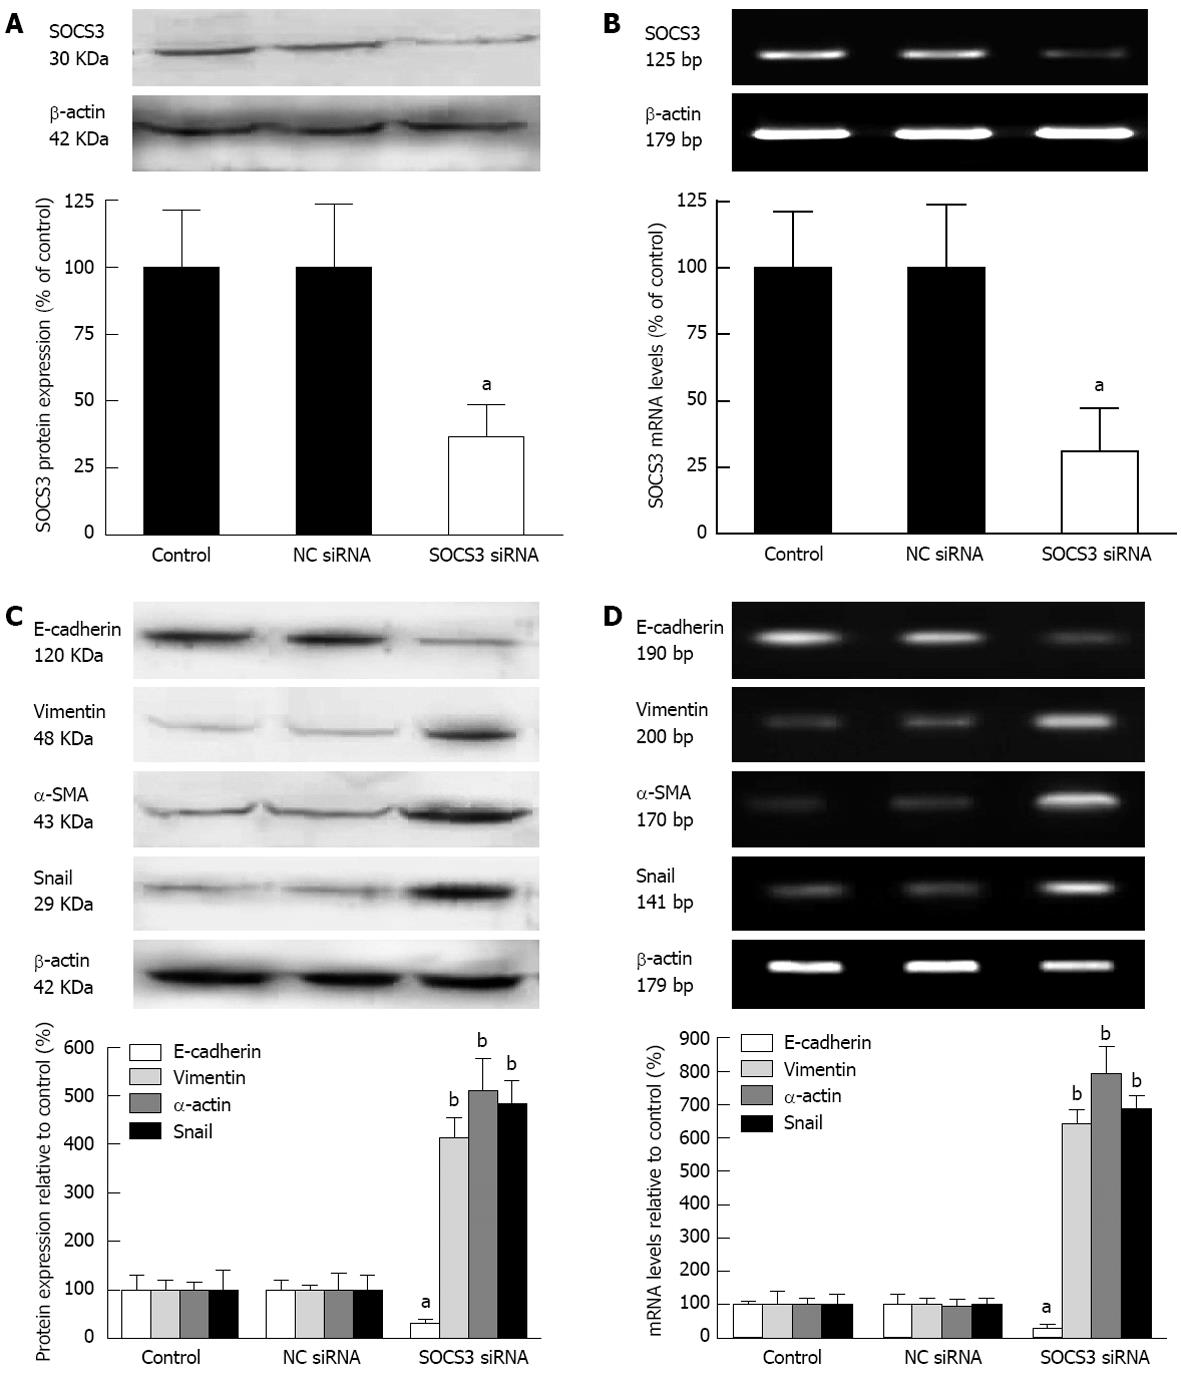
Figure 4 Effect of suppressor of cytokine signaling 3 small-interfering RNA on expression of epithelial-mesenchymal transition-associated molecules in MHCC97H cells.
The cells were transiently transfected with negative control (NC) small-interfering RNA (siRNA) or suppressor of cytokine signaling 3 (SOCS3) siRNA for 48 h. A: Protein expression and mRNA levels of SOCS3 in MHCC97H cells were detected by Western blotting; B: Reverse transcription-polymerase chain reaction (RT-PCR) and quantitative real-time PCR; C: Protein expression and mRNA levels of epithelial-mesenchymal transition-associated molecules in MHCC97H cells were analyzed by Western blotting; D: RT-PCR and quantitative real-time PCR after normalization to β-actin mRNA. Data are presented as the mean ± SD from three independent experiments. aP < 0.05, bP < 0.01 vs NC siRNA.
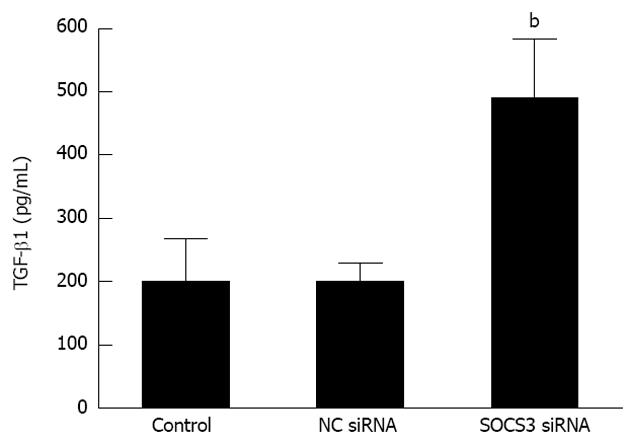
Figure 5 Effect of suppressor of cytokine signaling 3 small-interfering RNA on transforming growth factor-β1 levels in MHCC97H cells.
After application of negative control (NC) small-interfering RNA (siRNA) or suppressor of cytokine signaling 3 (SOCS3) siRNA for 48 h, concentration of transforming growth factor-β1 in the supernatant of the cells was measured by enzyme-linked immunosorbent assay. Data are presented as the mean ± SD from three independent experiments. bP < 0.01 vs NC siRNA. TGF: Transforming growth factor.
- Citation: Ji YY, Wang ZD, Li ZF, Li K. Interference of suppressor of cytokine signaling 3 promotes epithelial-mesenchymal transition in MHCC97H cells. World J Gastroenterol 2013; 19(6): 866-873
- URL: https://www.wjgnet.com/1007-9327/full/v19/i6/866.htm
- DOI: https://dx.doi.org/10.3748/wjg.v19.i6.866


