Copyright
©2013 Baishideng Publishing Group Co.
World J Gastroenterol. Dec 21, 2013; 19(47): 9012-9019
Published online Dec 21, 2013. doi: 10.3748/wjg.v19.i47.9012
Published online Dec 21, 2013. doi: 10.3748/wjg.v19.i47.9012
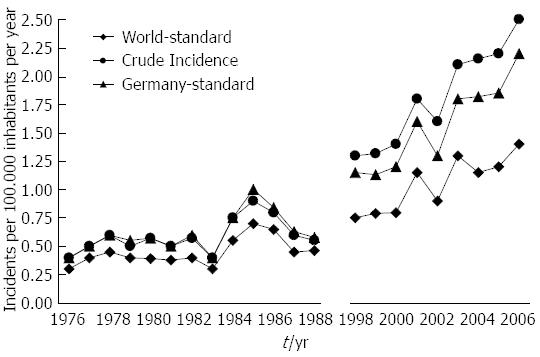
Figure 1 The incidence of gastroenteropancreatic neuroendocrine tumors is shown over time (1976-1988 and 1998-2006).
It is presented either as crude incidence or as the number of tumors (per 100.000) age-adjusted to the 1966 world standard population (World standard) or to the 1987 German standard population (German standard). The data shown originate from the former East German National Cancer Registry (DDR Krebsregister) for 1976-1988 or from its successor, the Joint Cancer Registry, for 1998-2006.
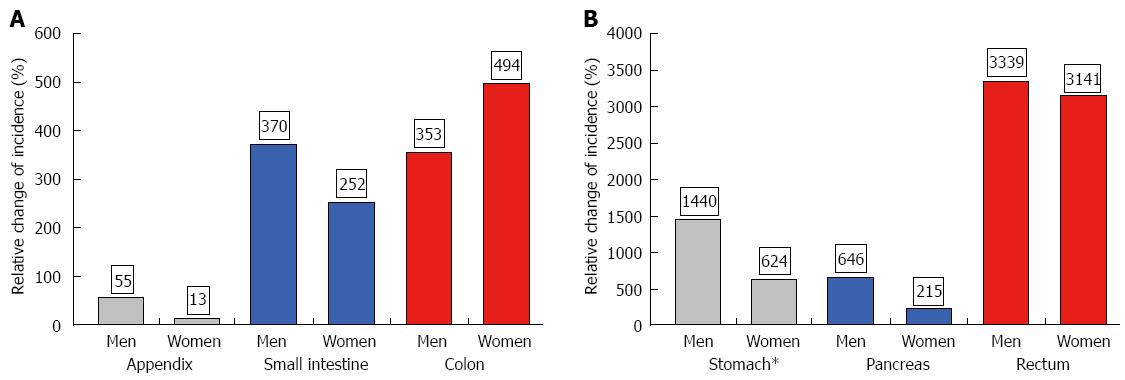
Figure 2 Relative changes in the incidence of gastroenteropancreatic neuroendocrine tumor are depicted according to tumor site and sex.
A: Changes were calculated for the reference periods 1976-1978 and 2004-2006*; the intervals 1979-1981 and 2004-2006 were chosen for the stomach, since no gastric NE neoplasms were registered in women before 1979; B: Changes in incidence are presented as relative increments age-adjusted to the 1987 German standard population. The data shown originate from the former East German National Cancer Registry (DDR Krebsregister) for the years 1976-1978 or from its successor, the Joint Cancer Registry, for the time period 2004-2006. NE: Neuroendocrine.
Figure 3 Absolute changes in the incidence of gastroenteropancreatic neuroendocrine tumor are shown according to tumor site and sex.
A: Changes were calculated for the reference periods 1976-1978 and 2004-2006*; the periods 1979-1981 and 2004-2006 were chosen for the stomach, since no registered gastric NE neoplasms were registered in women before 1979; B: Changes in incidence are presented as absolute increments age-adjusted to the 1987 German standard population. The data shown originate from the former East German National Cancer Registry (DDR Krebsregister) for the years 1976-1978 or from its successor, the Joint Cancer Registry, for the time period 2004-2006. NE: Neuroendocrine.
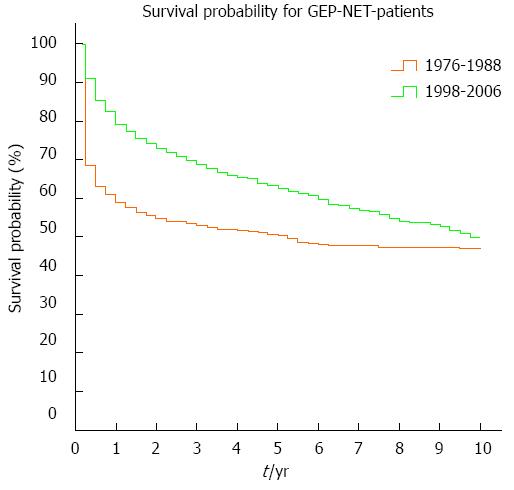
Figure 4 Overall survival of patients with gastroenteropancreatic neuroendocrine tumor.
Two periods of time are compared (1976-1988 and 1998-2006). GEP-NET: Gastroenteropancreatic neuroendocrine tumor.
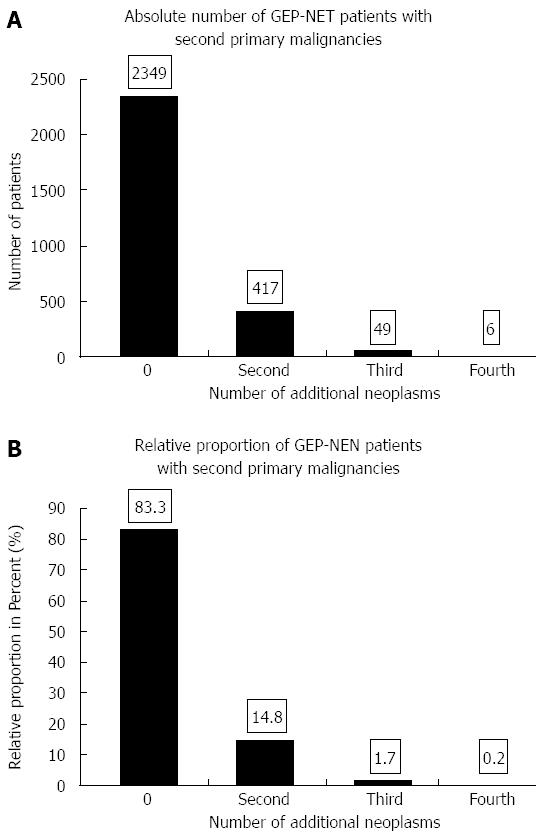
Figure 5 Second malignancies occurred in 472 of 2821 patients with gastroenteropancreatic neuroendocrine tumor.
A: The absolute number; B: The percentage of patients with one or more second (non-gastroenteropancreatic neuroendocrine tumor, non-GEP-NET) neoplasms. 0 = No second neoplasm. GEP-NET: Gastroenteropancreatic neuroendocrine tumor.
- Citation: Scherübl H, Streller B, Stabenow R, Herbst H, Höpfner M, Schwertner C, Steinberg J, Eick J, Ring W, Tiwari K, Zappe SM. Clinically detected gastroenteropancreatic neuroendocrine tumors are on the rise: Epidemiological changes in Germany. World J Gastroenterol 2013; 19(47): 9012-9019
- URL: https://www.wjgnet.com/1007-9327/full/v19/i47/9012.htm
- DOI: https://dx.doi.org/10.3748/wjg.v19.i47.9012


