Copyright
©2013 Baishideng Publishing Group Co.
World J Gastroenterol. Dec 14, 2013; 19(46): 8745-8751
Published online Dec 14, 2013. doi: 10.3748/wjg.v19.i46.8745
Published online Dec 14, 2013. doi: 10.3748/wjg.v19.i46.8745
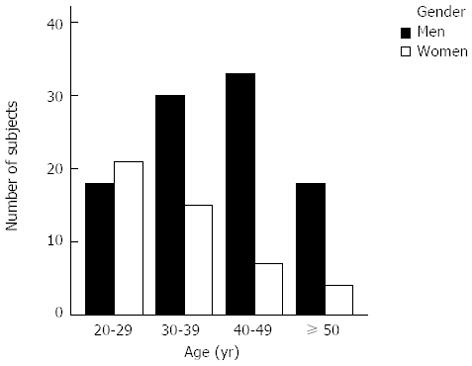
Figure 1 Distribution of volunteers according to age.
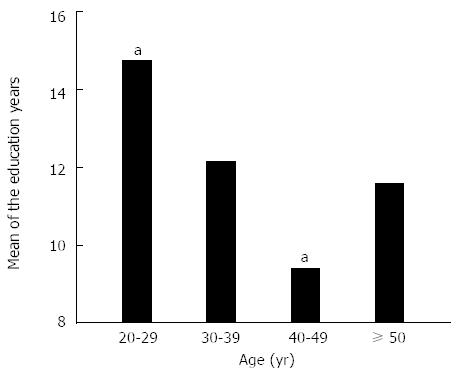
Figure 2 Comparison of education years between healthy volunteers of various age groups (aP < 0.
05).
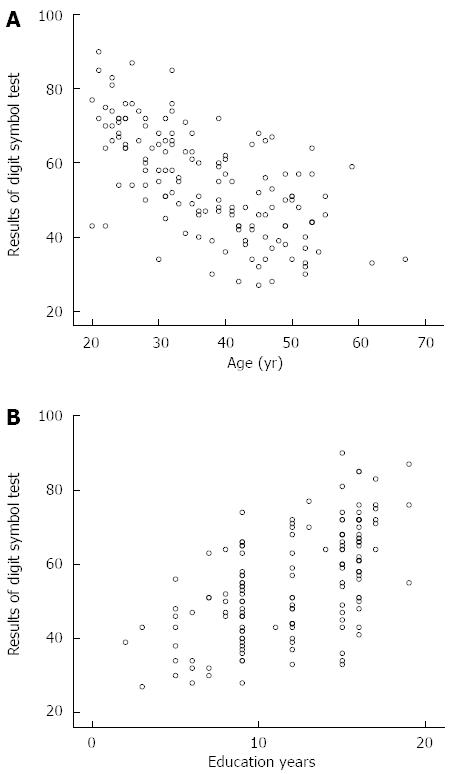
Figure 3 Distribution of the results from the digit symbol test in healthy volunteers according to age (A) and education years (B).
- Citation: Li SW, Wang K, Yu YQ, Wang HB, Li YH, Xu JM. Psychometric hepatic encephalopathy score for diagnosis of minimal hepatic encephalopathy in China. World J Gastroenterol 2013; 19(46): 8745-8751
- URL: https://www.wjgnet.com/1007-9327/full/v19/i46/8745.htm
- DOI: https://dx.doi.org/10.3748/wjg.v19.i46.8745


