Copyright
©2013 Baishideng Publishing Group Co.
World J Gastroenterol. Dec 7, 2013; 19(45): 8382-8390
Published online Dec 7, 2013. doi: 10.3748/wjg.v19.i45.8382
Published online Dec 7, 2013. doi: 10.3748/wjg.v19.i45.8382
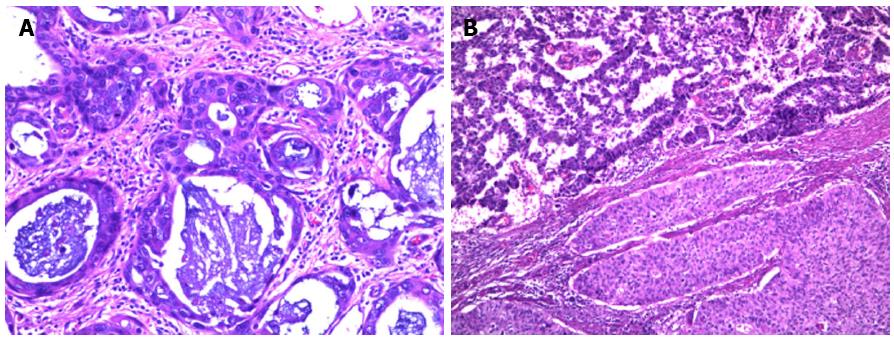
Figure 1 Adenosquamous carcinoma of the esophagus.
Adenocarcinoma and squamous cell carcinoma could be intermingled (A: Hematoxylin and eosin staining, × 200 magnification) or have a fairly clear boundary (B: Hematoxylin and eosin staining, × 100 magnification).
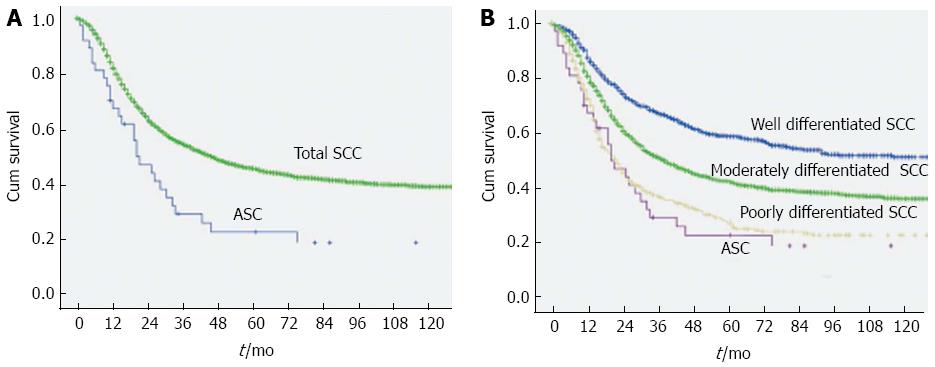
Figure 2 Comparison of Kaplan-Meier curves for patients with esophageal adenosquamous carcinoma and those with squamous cell carcinoma.
A: Kaplan-Meier curves for esophageal adenosquamous carcinoma (ASC) patients and total esophageal squamous cell carcinoma (SCC) patients. The survival difference was significant (P = 0.001); B: Kaplan-Meier curves for patients with esophageal ASC and those with different histological grades of SCC (between ASC and well-differentiated SCC, P < 0.001; between ASC and moderately differentiated SCC, P = 0.004; between ASC and poorly differentiated SCC, P = 0. 536).
- Citation: Chen SB, Weng HR, Wang G, Yang JS, Yang WP, Liu DT, Chen YP, Zhang H. Primary adenosquamous carcinoma of the esophagus. World J Gastroenterol 2013; 19(45): 8382-8390
- URL: https://www.wjgnet.com/1007-9327/full/v19/i45/8382.htm
- DOI: https://dx.doi.org/10.3748/wjg.v19.i45.8382


