Copyright
©2013 Baishideng Publishing Group Co.
World J Gastroenterol. Nov 28, 2013; 19(44): 8000-8010
Published online Nov 28, 2013. doi: 10.3748/wjg.v19.i44.8000
Published online Nov 28, 2013. doi: 10.3748/wjg.v19.i44.8000
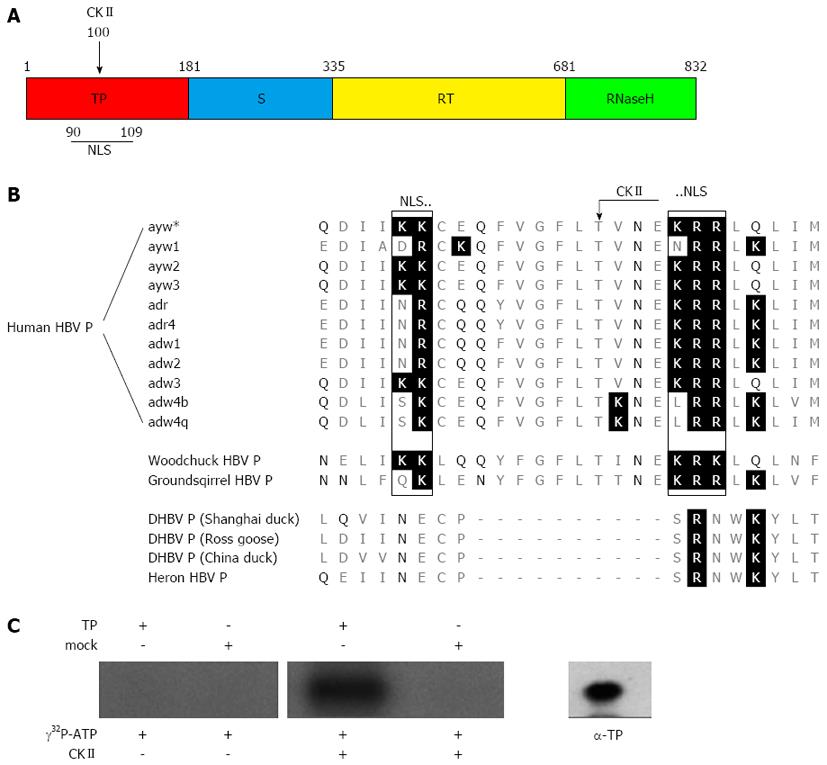
Figure 1 Sequence alignment of the hepatitis B virus polymerase from various virus subtypes and species.
A: Scheme of the hepatitis B virus (HBV) polymerase showing the different domains. The terminal protein domain (TP) is shown in red, the spacer domain (S) in blue, the reverse transcriptase domain (RT) in yellow and the RNase H domain in green. The numbers designate the amino acids referred to HBV genotype D. The positions of the casein kinase II (CKII) phosphorylation site and of the bipartite nuclear localization signal (NLS) identified in this study (see Figure 1B) are indicated; B: This figure shows amino acid alignment of Q86-M111 referred to the sequence of subtype ayw*, which was used in this study. Basic amino acids are highlighted by a black background and polar (δ+) amino acids are highlighted by black letters. A conserved protein kinase CKII recognition site (arrow) was identified in orthohepadnaviruses at Thr100 (protein kinase CKII: T/S-X-X-E/D; X = any amino acid). A bipartite nuclear localization signal was identified in orthohepadnaviruses, which is flanking the CKII recognition site by its two basic amino acid clusters (rectangles). All identified putative motifs were not found in the aligned P proteins of the compared avihepadnaviruses; C: Purified TP domain and mock purified proteins (empty vector products) were incubated with [γ-32P] ATP and recombinant protein kinase CKII. To control auto-phosphorylation TP domain was incubated with [γ-32P] ATP in absence of the kinase. The protein specificity was verified by Western blotting using a TP specific antibody (α-TP) on a separate lane. All experiments were performed in triplicate. One representative is shown.
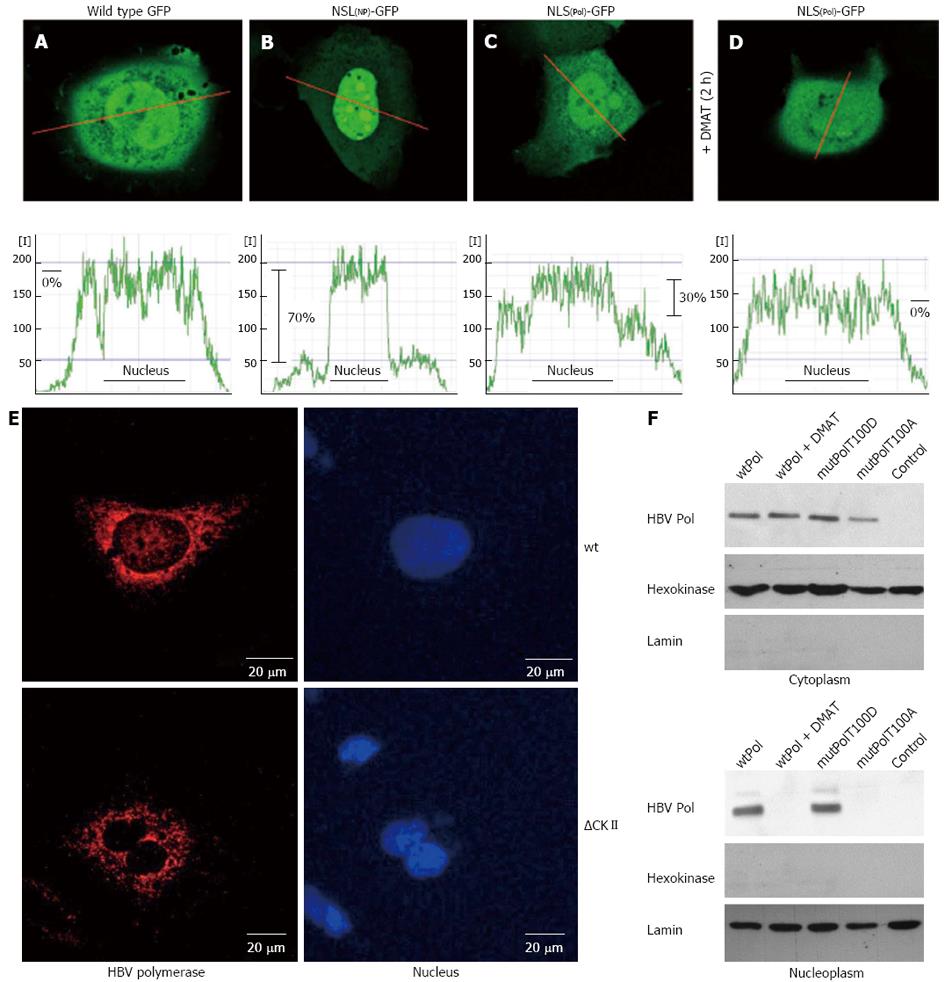
Figure 2 Hepatitis B virus polymerase harbors a functional nuclear localization signal in the terminal protein domain.
A-D: HuH-7 cells were transfected with (A) the negative control wild type green fluorescent protein (GFP) (pEGFP-N1), (B) a positive control: GFP fused to a prototype bipartite nuclear localization signal (NLS) of human nucleoplasmin, (C) GFP fused to the putative bipartite NLS of hepatitis B virus (HBV) P protein, (D) the same as (C) but cells were treated with 10 × IC50 of casein kinase II (CKII) inhibitor 2-Dimethylamino-4,5,6,7-tetrabromo-1H-benzimidazole (DMAT) 2 h prior analysis. The fluorescence was measured in living cells by confocal laser scan analysis. The central layer (out of 6) was quantitated along the red indicated line and displayed in the corresponding graph of the lower panel as relative fluorescence intensity [I]. Differences of mean fluorescence intensities in the cytoplasm and within the nucleus (indicated as black line in the graph) were calculated and are indicated in percent. One representative cell for each fusion protein is shown; E: Confocal immunofluorescence microscopy of HuH-7 cells transfected with an expression vector encoding wt P or the mutant ∆CKII (= T100I) that is not phosphorylated by CKII. For detection of P (red) a rabbit-derived spacer domain-specific serum was used. Nuclei were stained with DAPI (blue); F: HuH-7 cells were transfect with the indicated expression vectors and left untreated or treated with 10× IC50 of CKII inhibitor DMAT 5 h prior analysis. Transfection with pCDNA.3 served as control. Cells were lysed, the cytosolic and nuclear fraction were isolated by differential centrifugation and analyzed by western blotting. For detection of P a TP-domain specific serum was used. Detection of hexokinase and of lamin served as loading control and as control for the purity of the subcellular fractions. All experiments were performed in triplicate. One representative is shown.
Figure 3 Binding of karyopherin-α2 to terminal protein depends on casein kinase II mediated phosphorylation.
The interaction of soluble protein fraction of HuH-7 cells to immobilized terminal protein (TP) domain was investigated by western blotting of the sodium chloride eluted fractions 2-4. Karyopherin-α2 bound only to the casein kinase II (CKII) pre-treated TP column (upper panel). FP: Flow through of the CKII treated TP column; F: Flow trough of the untreated TP column.
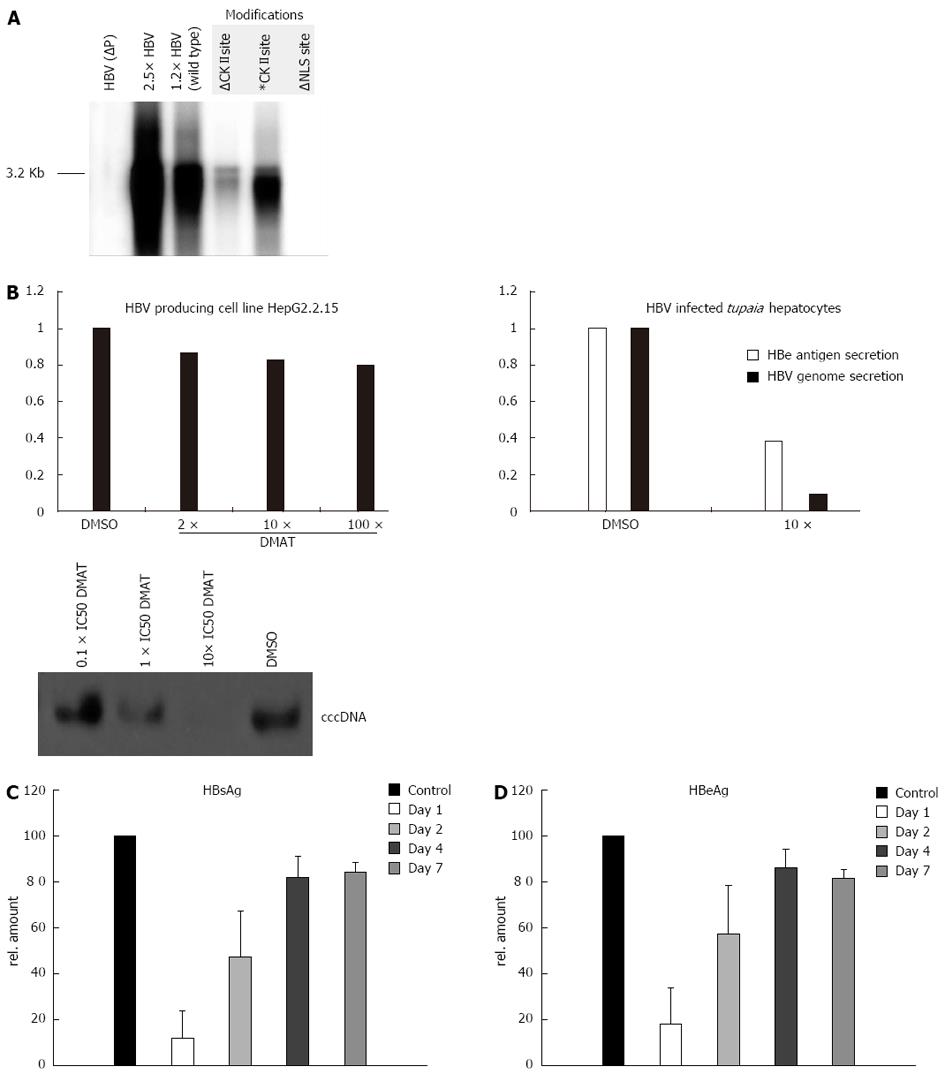
Figure 4 Casein kinase II inhibition impairs hepatitis B virus replication in infected primary Tupaia hepatocytes.
A: HuH-7 cells were transfected with mutant versions of a 1.2 fold hepatitis B virus (HBV) genome. After 5 d the secreted viral particles were precipitated with a HBs specific antibody and the containing 3.2 kb HBV genomes were visualized by the radioactive tracer [α-32P] dCTP incorporated using the endogenous polymerase activity. The unphosphorylated form of the casein kinase II (CKII) recognition site in the P protein was simulated by a T100I substitution (∆) and the pseudo-phosphorylation was simulated by a T100D substitution (*) in the 1.2 fold HBV wild type genome. The nuclear localization signal (NLS) was inactivated by mutating the downstream basic cluster (K105D and K106S) on the P protein. A 2.5 × HBV genome and a P deficient genome [HBV (P-)] served as controls; B: Primary Tupaia hepatocytes were infected with HepAD38 derived HBV and post infection treated for 36 h with solvent DMSO or 2-Dimethylamino-4,5,6,7-tetrabromo-1H-benzimidazole (DMAT) (10 × IC50). Twelve days after infection the HBV genome secretion was measured by Lightcycler polymerase chain reaction. The cccDNA content of infected Tupaia hepatocytes that were incubated for 36 h with the indicated amounts of DMAT was visualized by Southern blot using a HBV specific probe. The specificity of DMAT incubation was analyzed by 2 h inhibitor pre-treatment of the stably HBV transfected cell line HepG2.2.15 followed by treatment of 36 h with 10 × IC50 CKII inhibitor DMAT (IC50 in rat liver = 150 nmol/L) and genome secretion was compared to the solvent control DMSO measured by Lightcycler PCR. All experiments were performed in triplicate. The figure shows one representative experiment; C, D: Primary Tupaia hepatocytes were infected with HepAD38-derived HBV and at day 1, day 2, day 4 and day 7 treated for 36 h DMAT (10 × IC50). Twelve days after infection the HBV replication was measured by HBeAg or HBsAg-specific enzyme linked immunosorbent assay. The bars represent the standard deviation.
- Citation: Lupberger J, Schaedler S, Peiran A, Hildt E. Identification and characterization of a novel bipartite nuclear localization signal in the hepatitis B virus polymerase. World J Gastroenterol 2013; 19(44): 8000-8010
- URL: https://www.wjgnet.com/1007-9327/full/v19/i44/8000.htm
- DOI: https://dx.doi.org/10.3748/wjg.v19.i44.8000


