Copyright
©2013 Baishideng Publishing Group Co.
World J Gastroenterol. Nov 21, 2013; 19(43): 7804-7812
Published online Nov 21, 2013. doi: 10.3748/wjg.v19.i43.7804
Published online Nov 21, 2013. doi: 10.3748/wjg.v19.i43.7804
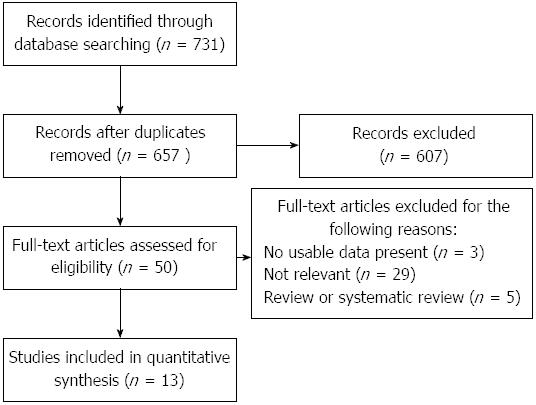
Figure 1 Flow diagram of meta-analysis study selection process.
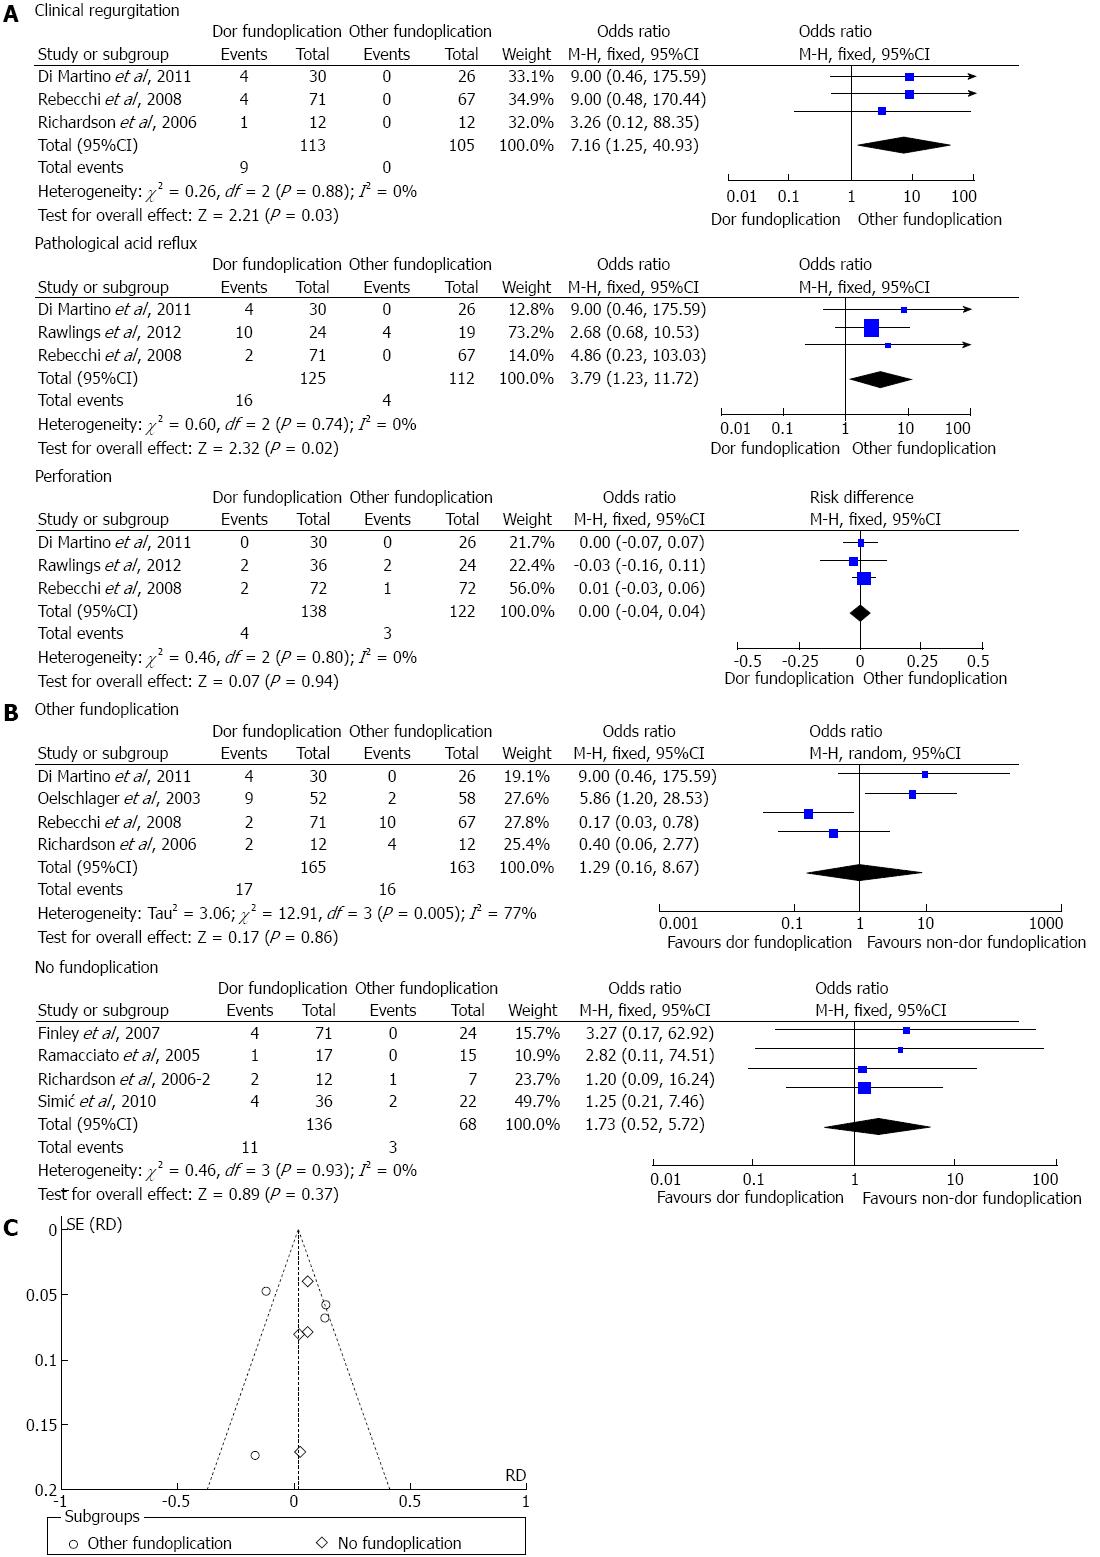
Figure 2 Forest plot.
A: Forest plot of the major outcomes in the Dor-other group; B: Forest plot of dysphagia symptoms in both the Dor-other and Dor-no groups; C: Funnel plot of dysphagia symptoms in both the Dor-other and Dor-no groups.
- Citation: Wei MT, He YZ, Deng XB, Zhang YC, Yang TH, Jin CW, Hu B, Wang ZQ. Is Dor fundoplication optimum after laparoscopic Heller myotomy for achalasia? A meta-analysis. World J Gastroenterol 2013; 19(43): 7804-7812
- URL: https://www.wjgnet.com/1007-9327/full/v19/i43/7804.htm
- DOI: https://dx.doi.org/10.3748/wjg.v19.i43.7804


