Copyright
©2013 Baishideng Publishing Group Co.
World J Gastroenterol. Oct 28, 2013; 19(40): 6902-6910
Published online Oct 28, 2013. doi: 10.3748/wjg.v19.i40.6902
Published online Oct 28, 2013. doi: 10.3748/wjg.v19.i40.6902
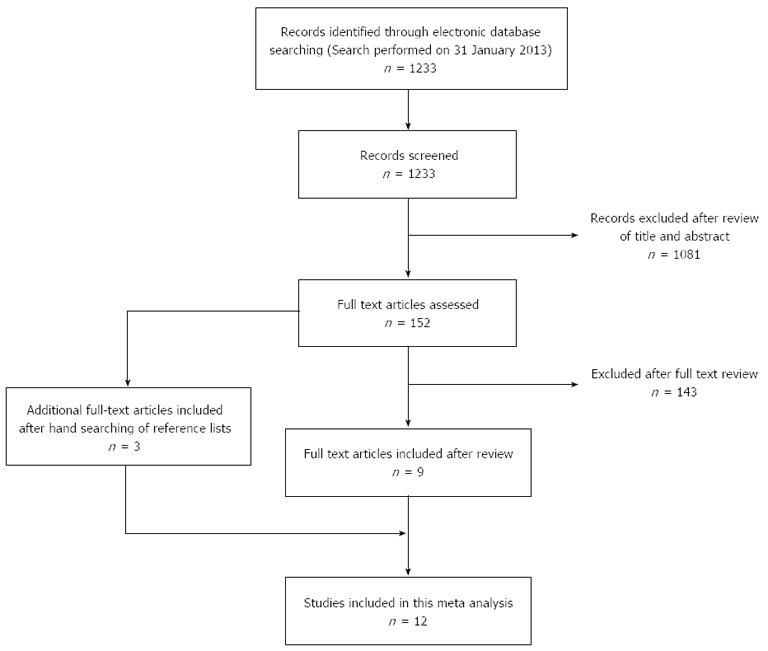
Figure 1 Flow chart of the publication selection process.
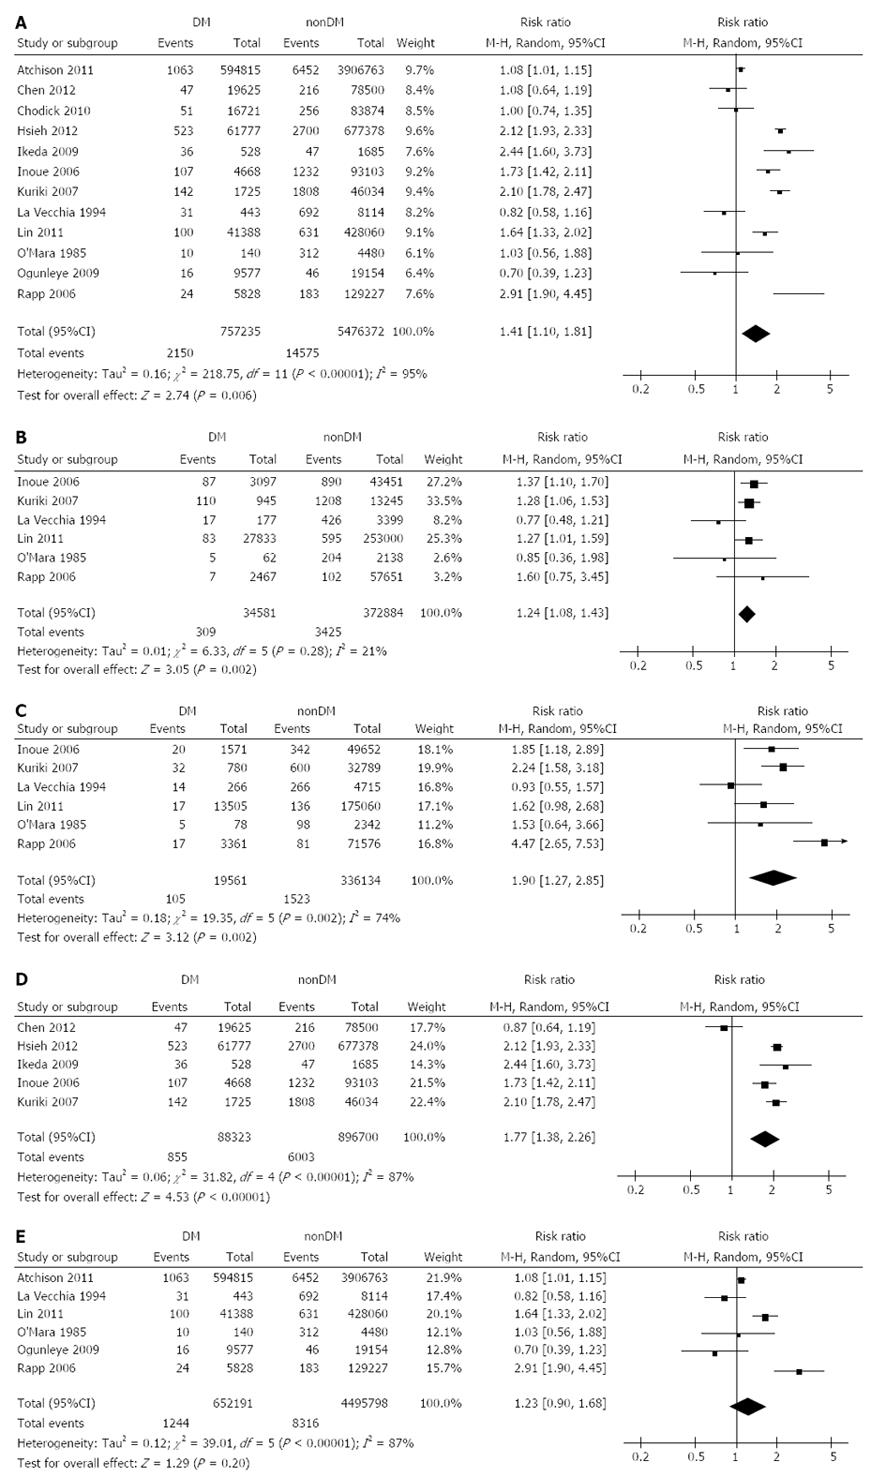
Figure 2 Forest plot representation-random-effects model.
A: All included publications. Stratified by sex; B: Male; C: Female, and stratified by geographical area; D: East Asia; E: The West. The individual block squares denote the RR for each study of gastric cancer risk among diabetes mellitus (DM) patients, with an area proportional to the amount of statistical information in each study. The horizontal line denotes a 95%CI, ending with an arrowhead when CI extends beyond the scale. The pooled estimate and its 95%CI are represented by a diamond. Squares or diamonds plotted in the right half indicate increased gastric cancer risk. The risk is considered significant only if the horizontal line or diamond does not overlap the solid vertical line.
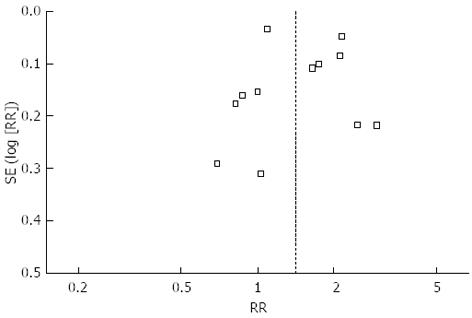
Figure 3 Funnel plot analysis of all the included publications.
- Citation: Shimoyama S. Diabetes mellitus carries a risk of gastric cancer: A meta-analysis. World J Gastroenterol 2013; 19(40): 6902-6910
- URL: https://www.wjgnet.com/1007-9327/full/v19/i40/6902.htm
- DOI: https://dx.doi.org/10.3748/wjg.v19.i40.6902


