Copyright
©2013 Baishideng Publishing Group Co.
World J Gastroenterol. Sep 14, 2013; 19(34): 5633-5644
Published online Sep 14, 2013. doi: 10.3748/wjg.v19.i34.5633
Published online Sep 14, 2013. doi: 10.3748/wjg.v19.i34.5633
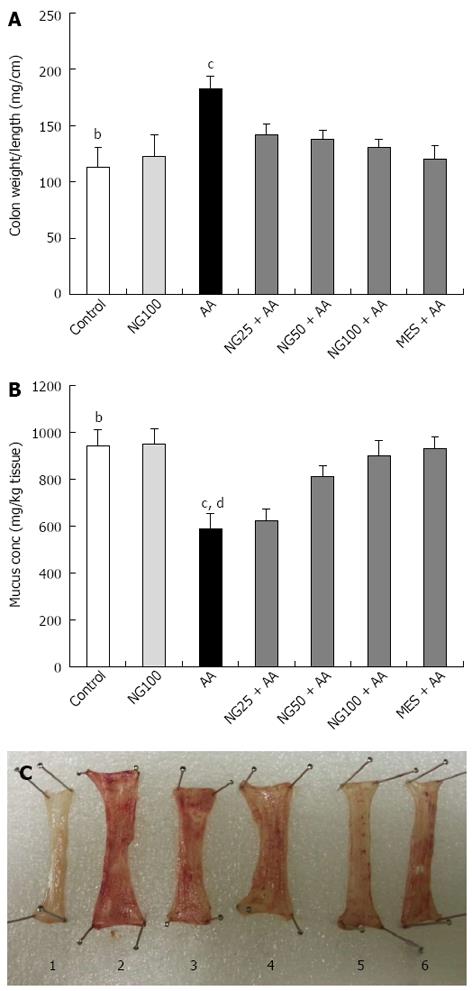
Figure 1 Effect of naringenin on colon weight/length (A), mucus concentration (B) and induction of ulceration and its protection by treatments in colonic tissue of rats with acetic acid-induced ulcerative colitis (C) (n = 6).
Values in (A) and (B) are expressed as mean ± SE and analyzed using one way analysis of variance followed by Newman-Keuls post hoc test. bP < 0.01 control vs acetic acid (AA); cP < 0.05, dP < 0.01 AA vs naringenin (NG) 25 + AA, NG50 + AA, NG100 + AA or mesalazine (MES) + AA groups. Groups in (C) are arranged as follows: control (1), AA (2), NG25 + AA (3), NG50 + AA (4), NG100 + AA (5) and MES + AA (6).
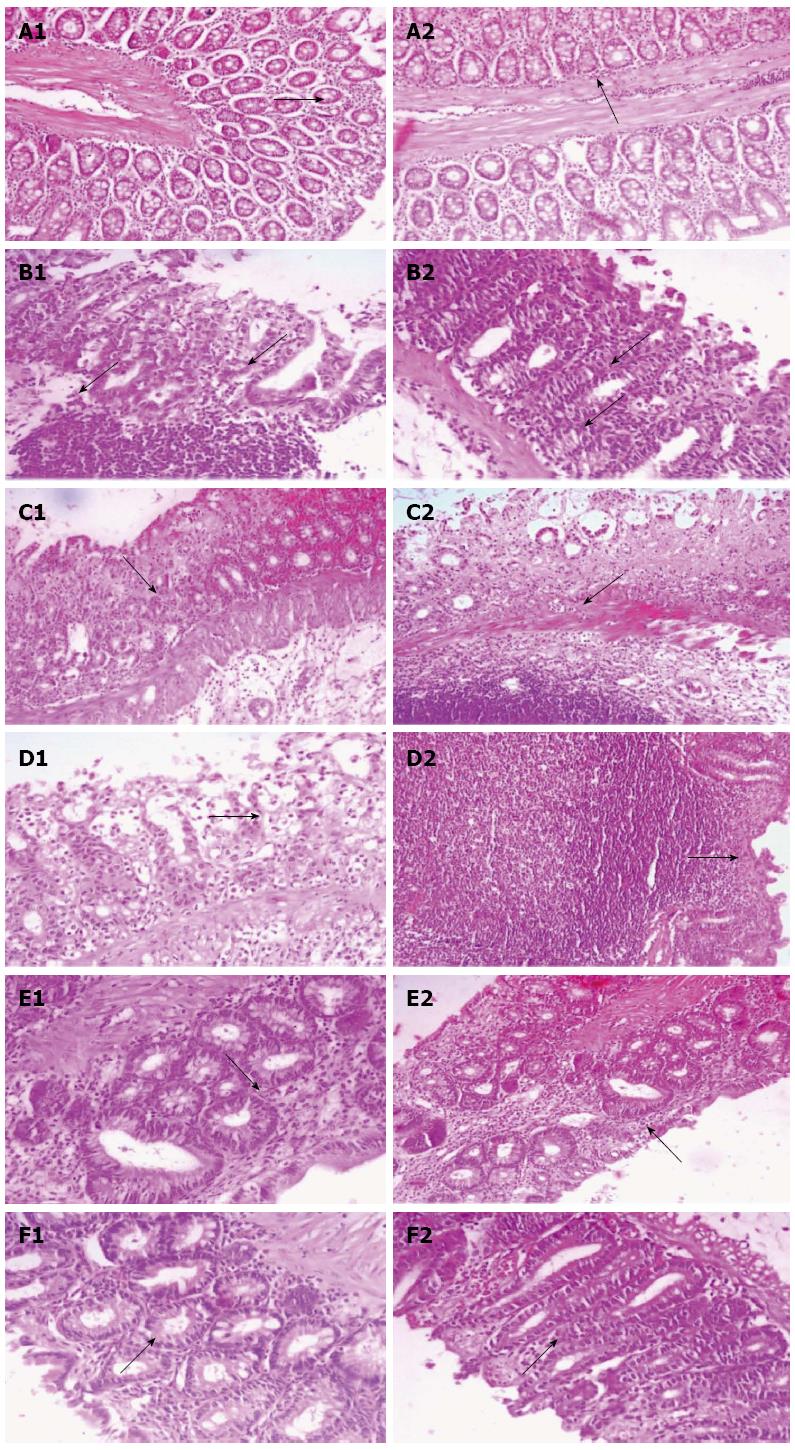
Figure 2 Histopathological changes with their intensity are presented.
A-1 and 2: Histopathological colonic sections showing normal benign looking mucosa; B-1 and 2: Diffused active colitis with superficial erosions, stormal edema, dense acute and chronic inflammatory cells infiltrate with widely ulcerating mucosa; C-1 and 2: Reparative epithelial changes with little ulcer healing and inflammatory cells infiltrate; D-1 and 2: Reparative epithelial changes and healing ulcer with lymphoid follicle form; E-1 and 2: Healing ulcer and reparative epithelial changes; F-1 and 2: Attenuated cell damage with complete ulcer healing. A1-F1 (× 400), A2-F2 (× 200).
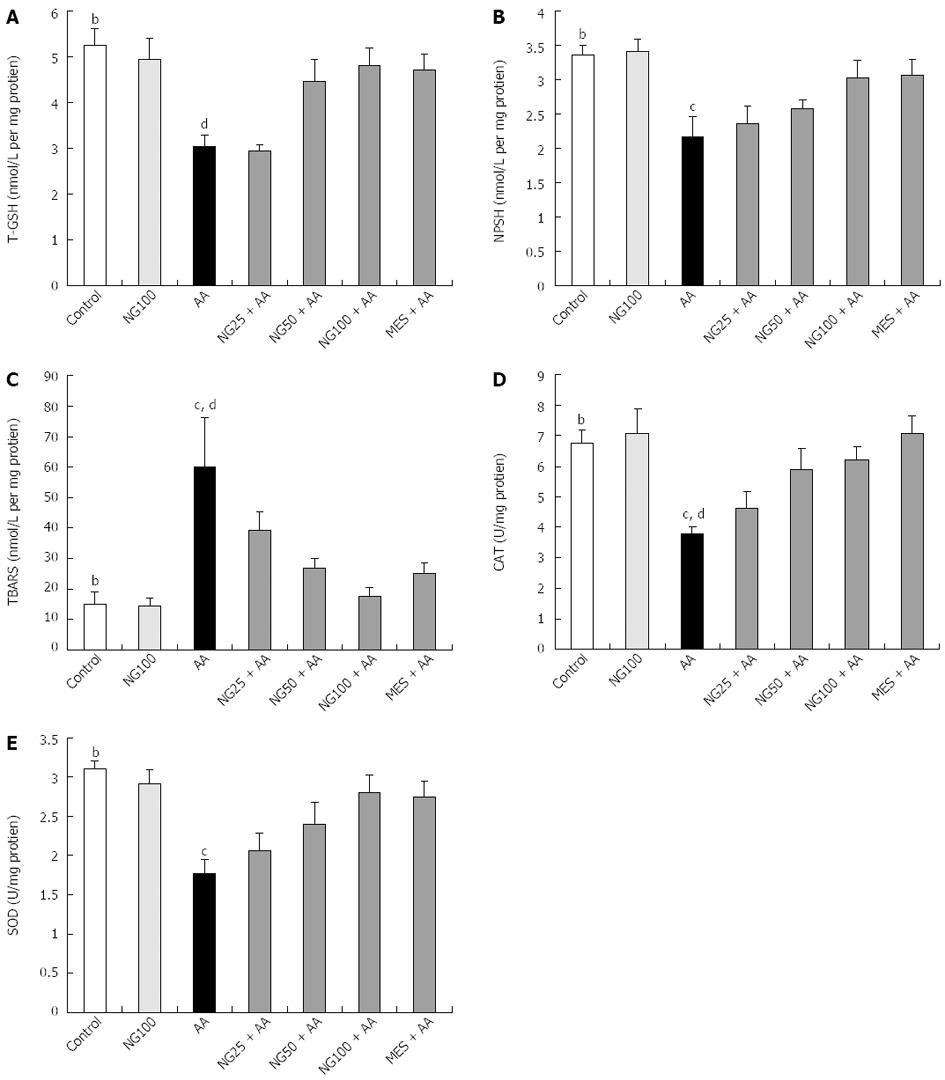
Figure 3 Effect of naringenin on total glutathione sulphadryls (A), non-protein sulphadryls (B) and thiobarbituric acid reactive substances levels (C) as well as catalase (D) and superoxide dismutase activities (E) in colonic tissue of rats with acetic acid-induced ulcerative colitis (n = 6).
Values are expressed as mean ± SE and analyzed using one way analysis of variance followed by Newman-Keuls post hoc test. bP < 0.01 control vs AA; cP < 0.05, dP < 0.01 AA vs NG25 + AA, NG50 + AA, NG100 + AA or MES + AA groups. T-GSH: Total glutathione sulphadryls; NP-SH: Non-protein sulphadryls; TBARS: Thiobarbituric acid reactive substances; CAT: Catalase; SOD: Superoxide dismutase; AA: Acetic acid; UC: Ulcerative colitis; MES: Mesalazine; NG: Naringenin.
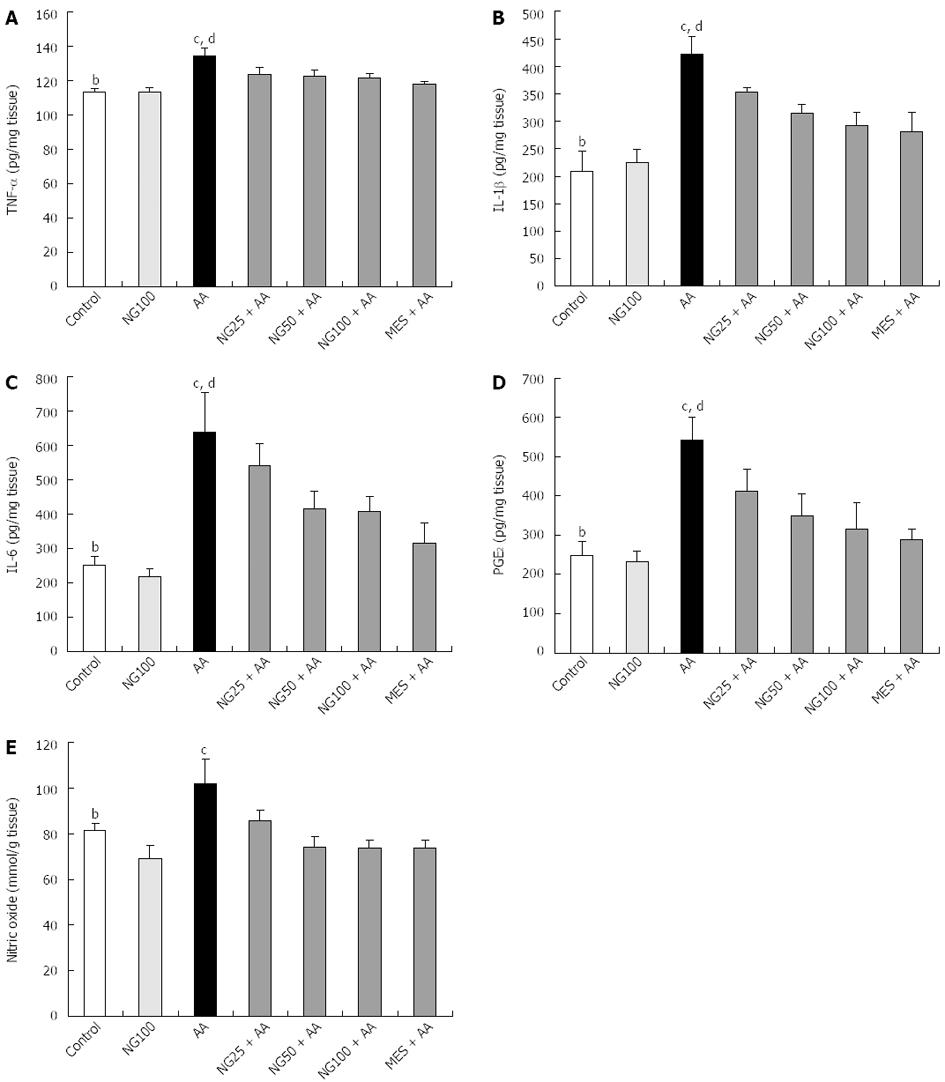
Figure 4 Effect of naringenin on tumor necrosis factor-α (A), interleukin-1β (B), interleukin-6 (C), prostaglandin E2 (D) and nitric oxide (E) levels in colonic tissue of rats with acetic acid-induced ulcerative colitis (n = 6).
Values are expressed as mean ± SE and analyzed using one way analysis of variance followed by Newman-Keuls post hoc test. bP < 0.01 control vs AA; cP < 0.05, dP < 0.01 AA vs NG25 + AA, NG50 + AA, NG100 + AA or MES + AA groups. TNF-α: Tumor necrosis factor-α; IL-1β: Interleukin-1β; IL-6: Interleukin-6; PGE2: Prostaglandin E2; AA: Acetic acid; NG: Naringenin; MES: Mesalazine.
- Citation: Al-Rejaie SS, Abuohashish HM, Al-Enazi MM, Al-Assaf AH, Parmar MY, Ahmed MM. Protective effect of naringenin on acetic acid-induced ulcerative colitis in rats. World J Gastroenterol 2013; 19(34): 5633-5644
- URL: https://www.wjgnet.com/1007-9327/full/v19/i34/5633.htm
- DOI: https://dx.doi.org/10.3748/wjg.v19.i34.5633


