Copyright
©2013 Baishideng Publishing Group Co.
World J Gastroenterol. Sep 7, 2013; 19(33): 5542-5550
Published online Sep 7, 2013. doi: 10.3748/wjg.v19.i33.5542
Published online Sep 7, 2013. doi: 10.3748/wjg.v19.i33.5542
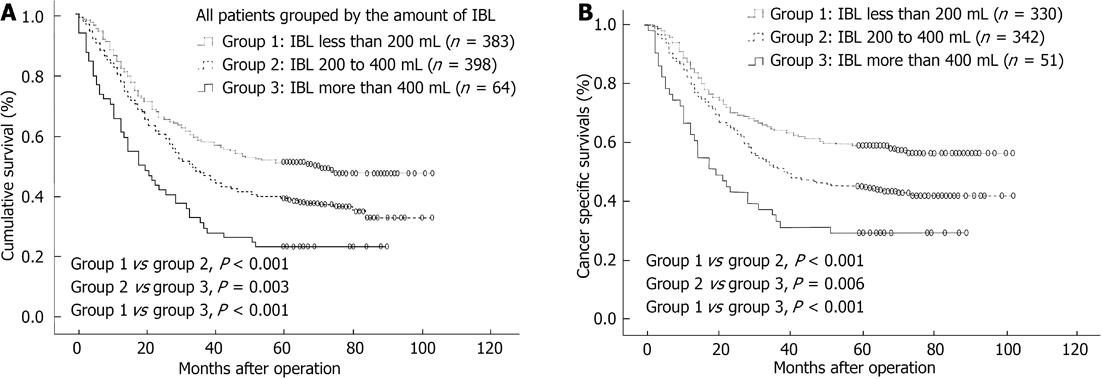
Figure 1 Overall survival and cancer-specific curves for all patients grouped by intraoperative blood loss.
A: Overall survival curve; B: Cancer-specific survival curve. IBL: Intraoperative blood loss.
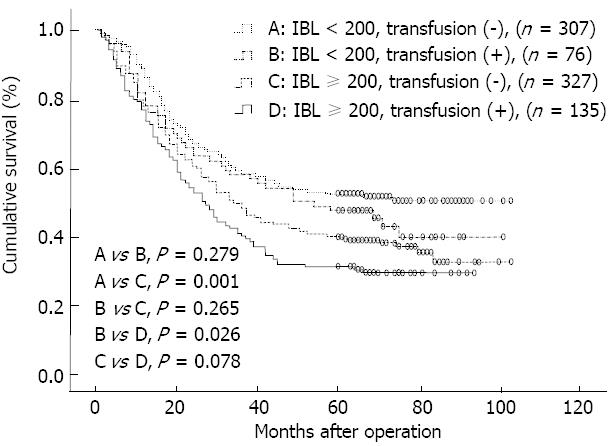
Figure 2 Overall survival curves for all patients classified according to intraoperative blood loss and red blood cell transfusion.
IBL: Intraoperative blood loss.
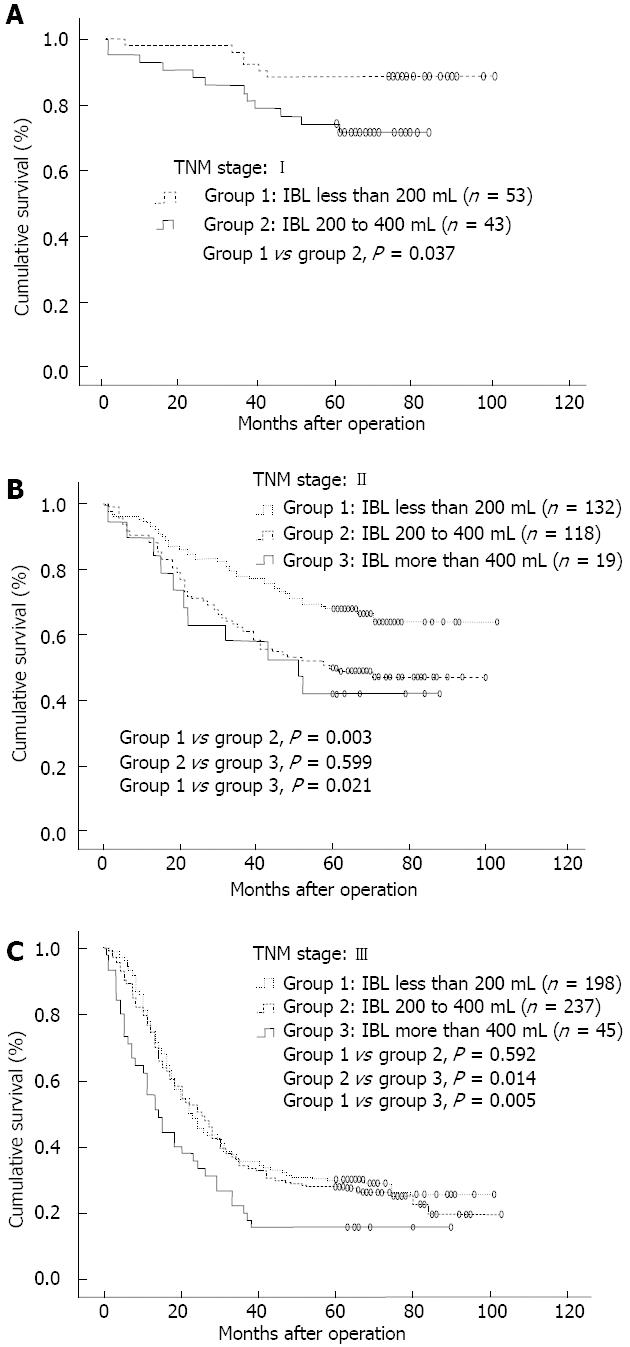
Figure 3 Overall survival curves.
A: 96 patients staged tumour-node-metastasis (TNM) I; B: 269 patients staged TNM II; C: 480 patients staged TNM III. IBL: Intraoperative blood loss.
- Citation: Liang YX, Guo HH, Deng JY, Wang BG, Ding XW, Wang XN, Zhang L, Liang H. Impact of intraoperative blood loss on survival after curative resection for gastric cancer. World J Gastroenterol 2013; 19(33): 5542-5550
- URL: https://www.wjgnet.com/1007-9327/full/v19/i33/5542.htm
- DOI: https://dx.doi.org/10.3748/wjg.v19.i33.5542


