Copyright
©2013 Baishideng Publishing Group Co.
World J Gastroenterol. Aug 28, 2013; 19(32): 5261-5270
Published online Aug 28, 2013. doi: 10.3748/wjg.v19.i32.5261
Published online Aug 28, 2013. doi: 10.3748/wjg.v19.i32.5261
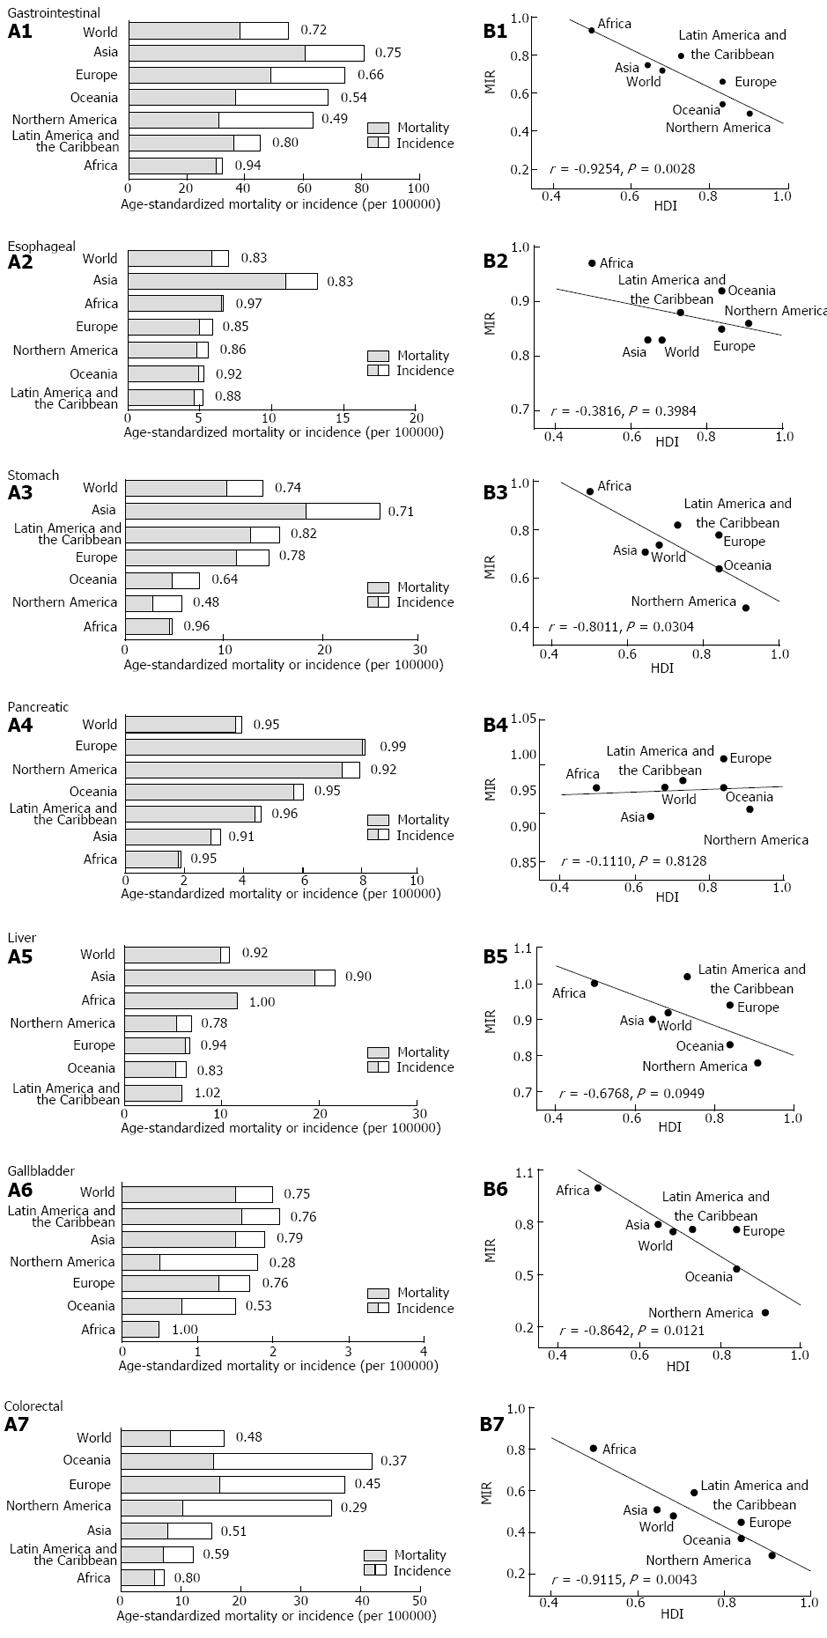
Figure 1 Association between the mortality-to-incidence ratio and human development at the regional level.
A: Regional age-standardized mortality (grey) and incidence (white and grey) rates per 100000 individuals for gastrointestinal cancers. The mortality-to-incidence ratios (MIRs) are denoted; B: The regional MIRs of gastrointestinal cancers overall and stomach, liver and colorectal cancers correlate with the human development index (HDI). Best-fit lines by linear regression (solid) are indicated.
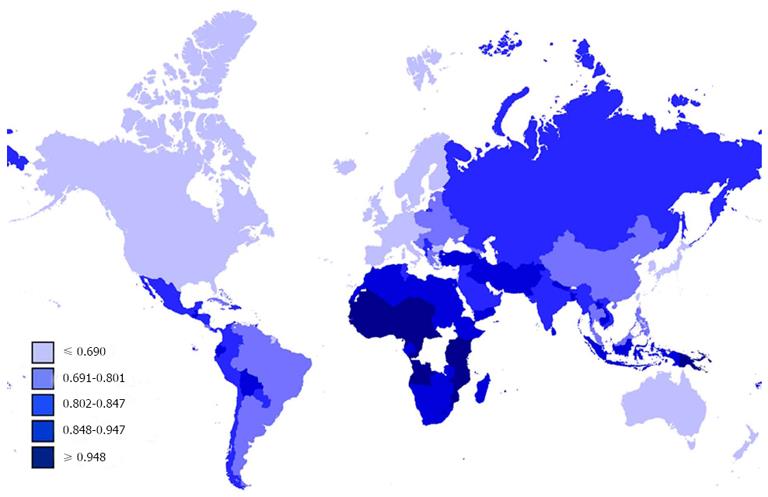
Figure 2 Global mortality-to-incidence ratios of gastrointestinal cancers.
Mortality-to-incidence ratios (MIRs) varied across different countries.
Figure 3 Correlation between national human development index and mortality-to-incidence ratio of gastrointestinal cancers via (A) linear or (B) non-linear regression.
Best-fit line by regression (solid) is indicated, with r or R values denoted.
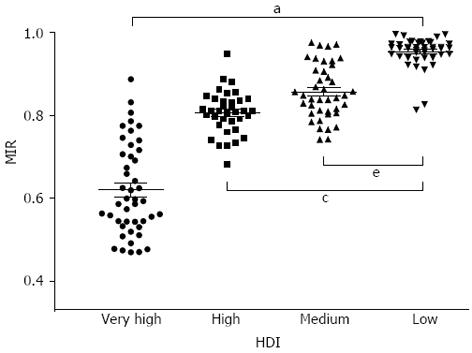
Figure 4 Overall mortality-to-incidence ratio of gastrointestinal cancers in four human development index groups.
The mortality-to-incidence ratio (MIR) differs significantly among areas having very high, high, medium and low human development index (HDI); aP < 0.05 vs very high HDI areas; cP < 0.05 vs high HDI areas; and eP < 0.05 vs medium HDI areas; one-way ANOVA followed by the Tukey-Kramer post-hoc test.
- Citation: Hu QD, Zhang Q, Chen W, Bai XL, Liang TB. Human development index is associated with mortality-to-incidence ratios of gastrointestinal cancers. World J Gastroenterol 2013; 19(32): 5261-5270
- URL: https://www.wjgnet.com/1007-9327/full/v19/i32/5261.htm
- DOI: https://dx.doi.org/10.3748/wjg.v19.i32.5261


