Copyright
©2013 Baishideng Publishing Group Co.
World J Gastroenterol. Jul 14, 2013; 19(26): 4221-4227
Published online Jul 14, 2013. doi: 10.3748/wjg.v19.i26.4221
Published online Jul 14, 2013. doi: 10.3748/wjg.v19.i26.4221
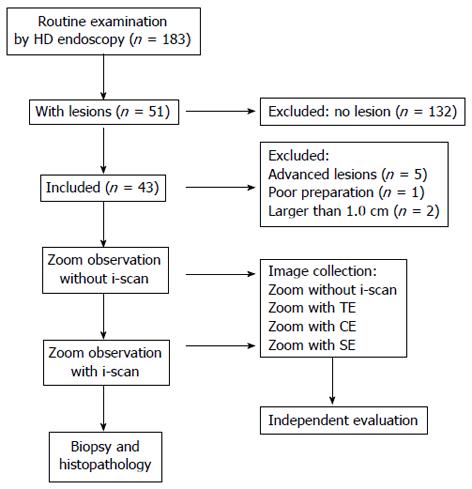
Figure 1 Study flow diagram.
TE: Tone enhancement; SE: Surface enhancement; CE: Color enhancement.
Figure 2 Images representing typical pit pattern classification by M i-scan.
A: Type I, small round pits of uniform size and shape; B: Type II, slit-like pits; C: Type III, gyrus and villous patterns; D: Type IV, irregular arrangement and size; E: Type V, destructive pattern.
Figure 3 Representative images showing white light (A), M i-scan with tone enhancement (B), surface enhancement (C) and color enhancement (D), respectively.
- Citation: Li CQ, Li Y, Zuo XL, Ji R, Li Z, Gu XM, Yu T, Qi QQ, Zhou CJ, Li YQ. Magnified and enhanced computed virtual chromoendoscopy in gastric neoplasia: A feasibility study. World J Gastroenterol 2013; 19(26): 4221-4227
- URL: https://www.wjgnet.com/1007-9327/full/v19/i26/4221.htm
- DOI: https://dx.doi.org/10.3748/wjg.v19.i26.4221


