Copyright
©2013 Baishideng Publishing Group Co.
World J Gastroenterol. Jul 14, 2013; 19(26): 4200-4208
Published online Jul 14, 2013. doi: 10.3748/wjg.v19.i26.4200
Published online Jul 14, 2013. doi: 10.3748/wjg.v19.i26.4200
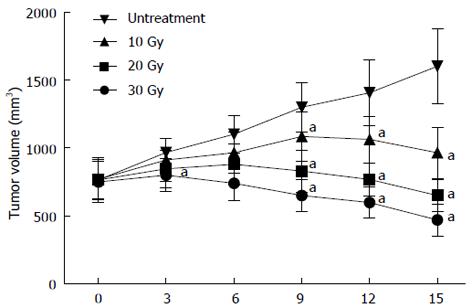
Figure 1 Effect of radiotherapy on the growth of human pancreatic tumor in nude mouse.
Mice received a subcutaneous injection of SW1990 cells. When the tumor volume reached about 800 mm3, the mice were divided into four groups. Group A mice were used as untreated controls. Groups B, C, and D received 10, 20, and 30 Gy radiation doses, respectively. Tumor size was measured for two weeks. aP < 0.05 vs the untreated group.
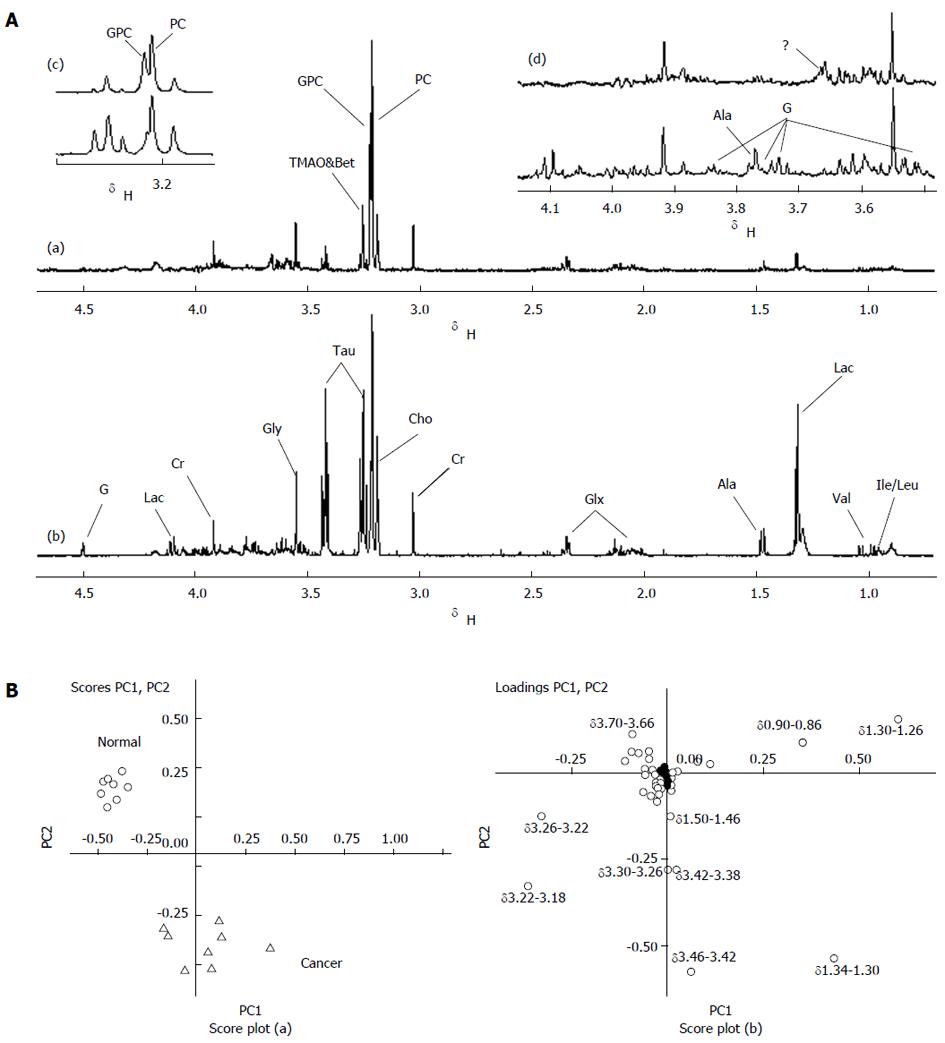
Figure 2 High-resolution magic angle spinning proton magnetic resonance spectroscopy spectra of normal pancreas and transplanted pancreatic tumor (500 mHz).
A: Normal pancreas (a); Transplanted pancreatic tumor (b); Amplified data from spectra region δ3.30-3.15 (c); Amplified data from spectra region δ3.15-3.48 (d). For peak assignments, see list of abbreviations used; B: Principal Component Analysis to compare the metabolic profiles between normal pancreas and pancreatic cancer based on the high-resolution magic angle spinning proton magnetic resonance spectroscopy spectra. Panels (a) and (b) are score and loading plots. ❍: Normal pancreas; ∆: Pancreatic cancer.
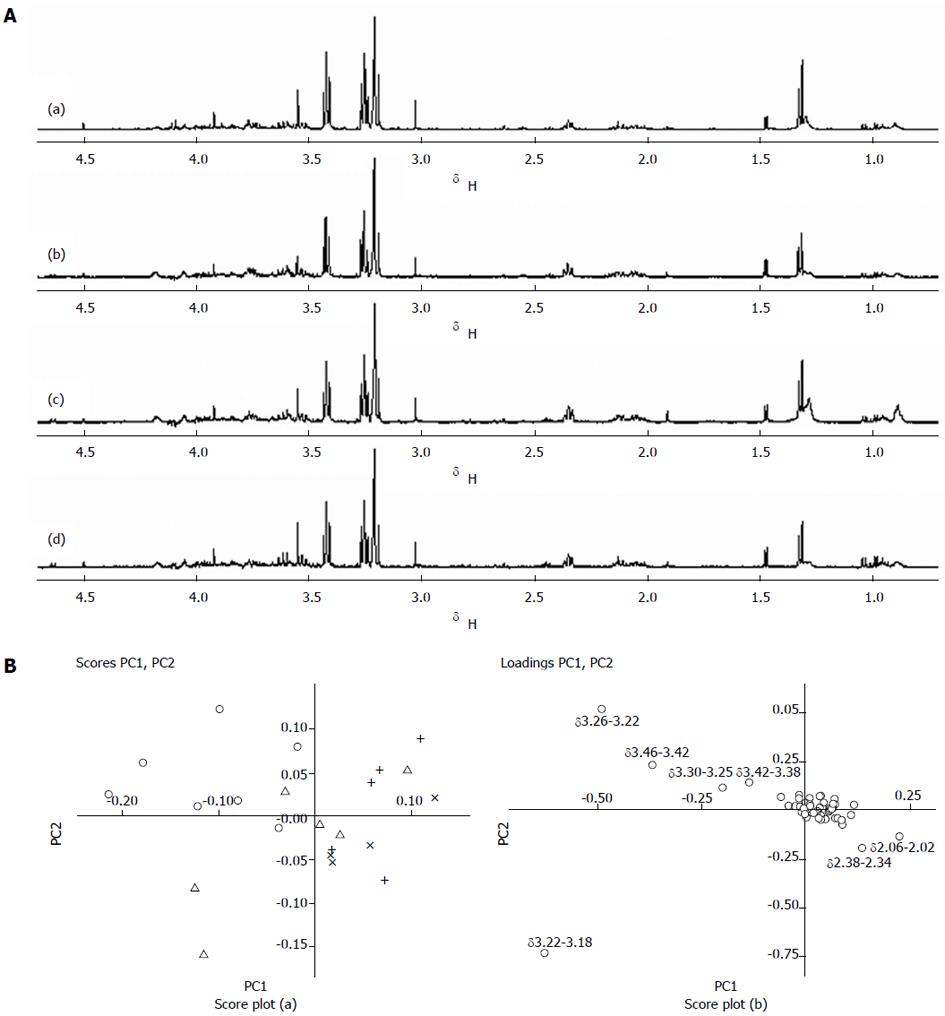
Figure 3 High-resolution magic angle spinning proton magnetic resonance spectroscopy spectra of transplanted pancreatic tumor after radiotherapy (500 mHz).
A: Untreated group(a); 10 Gy treatment group (b); 20 Gy treatment group (c); 30 Gy treatment group (d); B: Principal component analysis to compare the metabolic profiles of the pancreatic tumor after radiotherapy based on the high-resolution magic angle spinning proton magnetic resonance spectroscopy spectra. Panels (a) and (b) are scores and loadings plots. ❍: Untreated group; ∆: 10 Gy treatment group; ×: 20 Gy treatment group; +: 30 Gy treatment group.
- Citation: He XH, Li WT, Gu YJ, Yang BF, Deng HW, Yu YH, Peng WJ. Metabonomic studies of pancreatic cancer response to radiotherapy in a mouse xenograft model using magnetic resonance spectroscopy and principal components analysis. World J Gastroenterol 2013; 19(26): 4200-4208
- URL: https://www.wjgnet.com/1007-9327/full/v19/i26/4200.htm
- DOI: https://dx.doi.org/10.3748/wjg.v19.i26.4200


