Copyright
©2013 Baishideng Publishing Group Co.
World J Gastroenterol. Jul 14, 2013; 19(26): 4137-4145
Published online Jul 14, 2013. doi: 10.3748/wjg.v19.i26.4137
Published online Jul 14, 2013. doi: 10.3748/wjg.v19.i26.4137
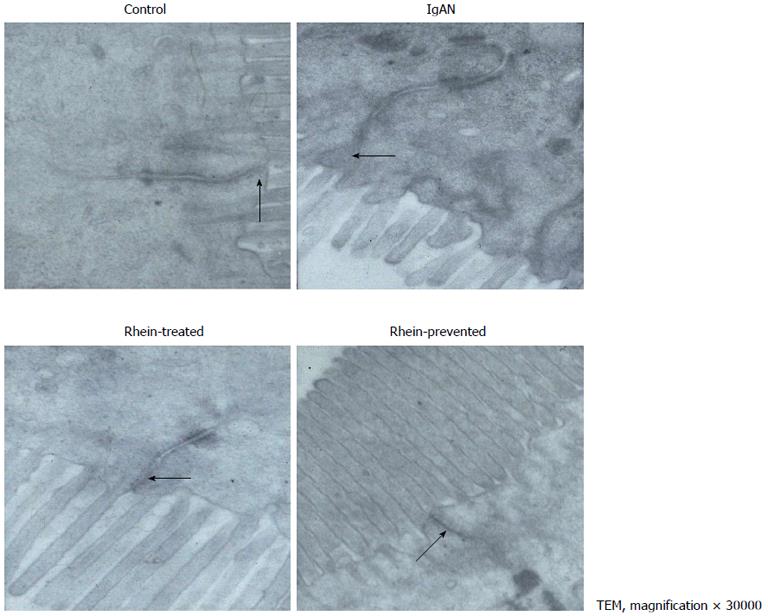
Figure 1 Electron micrograph of intestinal epithelial cells showing tight junction.
A: In the control group, the tight junction appeared as an electron-dense belt at the apex of the intestinal epithelial cells (arrow), indicating an intact intestinal mucosal barrie; B: In the IgA nephropathy (IgAN) group group, the intercellular space was widened, the tight junction was indistinct, and the density was reduced (arrow); C and D: In the Rhein-treated and Rhein-prevented groups, the density of the tight junctions was increased compared with that in the IgAN group (arrows). TEM: Transmission electron microscopy.
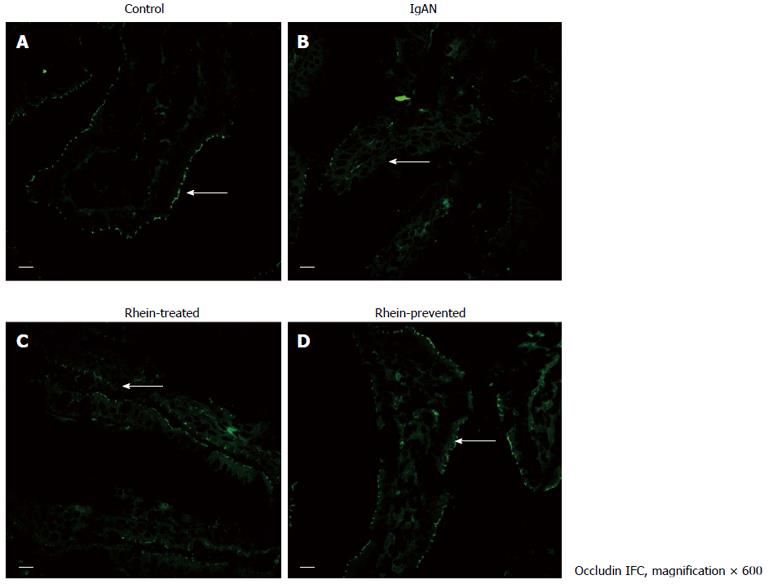
Figure 2 Location of tight junction protein occludin in rat ileum.
Laser confocal microscope immunofluorescence staining of ileum from all four groups of rats. A: Cross-section of a normal intestinal villus. Immunoreactive occludin was localized at the apex of intestinal epithelial cells, consistent with the site of the intestinal mucosal barrier (arrow); B: Cross-section of an intestinal villus in the IgA nephropathy (IgAN) group. Occludin immunofluorescence staining became weak and discontinuous (arrow); C and D: Cross-section of an intestinal villus in the Rhein-treated group and cross-section of an intestinal villus in the Rhein-prevented group. Compared with the IgAN group, occludin immunofluorescence staining became stronger and continuous (arrows). Scale bars = 10 μm. IFC: Integrated fluidic circuit.
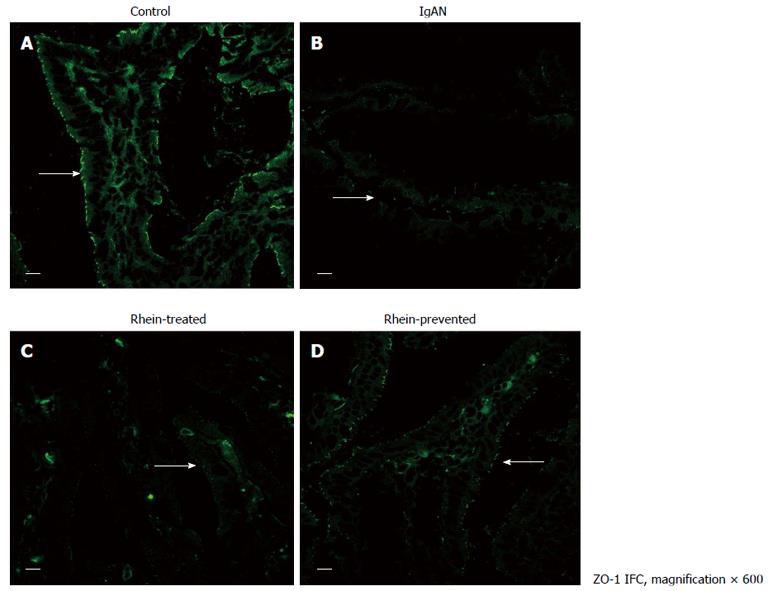
Figure 3 Location of tight junction protein zona occludens protein-1 in rat ileum.
Laser confocal microscope immunofluorescence staining of ileum from all four groups of rats. A: Cross-section of a normal intestinal villus. Immunoreactive zona occludens protein (ZO)-1 was localized at the apex of intestinal epithelial cells, consistent with the site of the intestinal mucosal barrier (arrow); B: Cross-section of an intestinal villus in the IgA nephropathy (IgAN) group. ZO-1 immunofluorescence staining became weak and discontinuous (arrow); C and D: Cross-section of an intestinal villus in the Rhein-treated group and cross-section of an intestinal villus in the Rhein-prevented group. Compared with the IgAN group, ZO-1 immunofluorescence staining became stronger and continuous (arrows). Scale bars = 10 μm. IFC: Integrated fluidic circuit.
Figure 4 Reverse transcriptase polymerase chain reaction analysis for zona occludens protein-1 and occludin mRNA in rat ileum.
By reverse transcriptase polymerase chain reaction, amplification products of expected size [150 bp for zona occludens protein (ZO)-1 and 170 bp for occludin] were obtained in the ileum in all four groups of rats. β-actin was the housekeeping protein. The levels of occludin and ZO-1 expression in the IgA nephropathy (IgAN) group were lower than in the control group. In the Rhein-treated and Rhein-prevented groups, the levels were higher than in the IgAN group. 1: Control; 2: IgAN; 3: Rhein-treated; 4: Rhein-prevented.
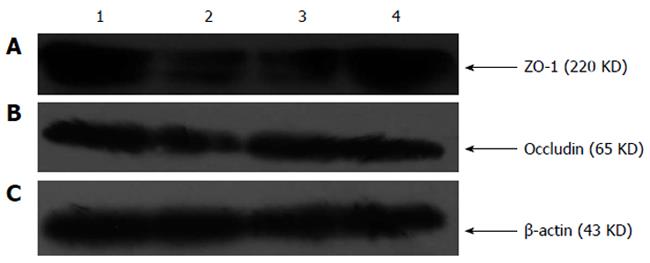
Figure 5 Western blotting analysis for zona occludens protein-1 and occludin of rat ileum.
Western blotting analysis revealed zona occludens protein (ZO)-1 immunoreactivity by a band of 220 kDa in the control group and by a weaker band at the same level in the IgA nephropathy (IgAN) group. Compared with the IgAN group, there were stronger bands at the same level in the Rhein-treated and Rhein-prevented groups. Occludin immunoreactivity was revealed by a band of 65 kDa in the control group and by a weaker band at the same level in the IgAN group. Compared with the IgAN group, there were stronger bands at the same level in the Rhein-treated and Rhein-prevented groups. β-Actin was the housekeeping protein. 1: Control; 2: IgAN; 3: Rhein-treated; 4: Rhein-prevented.
- Citation: Peng SN, Zeng HH, Fu AX, Chen XW, Zhu QX. Effects of rhein on intestinal epithelial tight junction in IgA nephropathy. World J Gastroenterol 2013; 19(26): 4137-4145
- URL: https://www.wjgnet.com/1007-9327/full/v19/i26/4137.htm
- DOI: https://dx.doi.org/10.3748/wjg.v19.i26.4137


