Copyright
©2013 Baishideng Publishing Group Co.
World J Gastroenterol. Jul 7, 2013; 19(25): 4007-4014
Published online Jul 7, 2013. doi: 10.3748/wjg.v19.i25.4007
Published online Jul 7, 2013. doi: 10.3748/wjg.v19.i25.4007
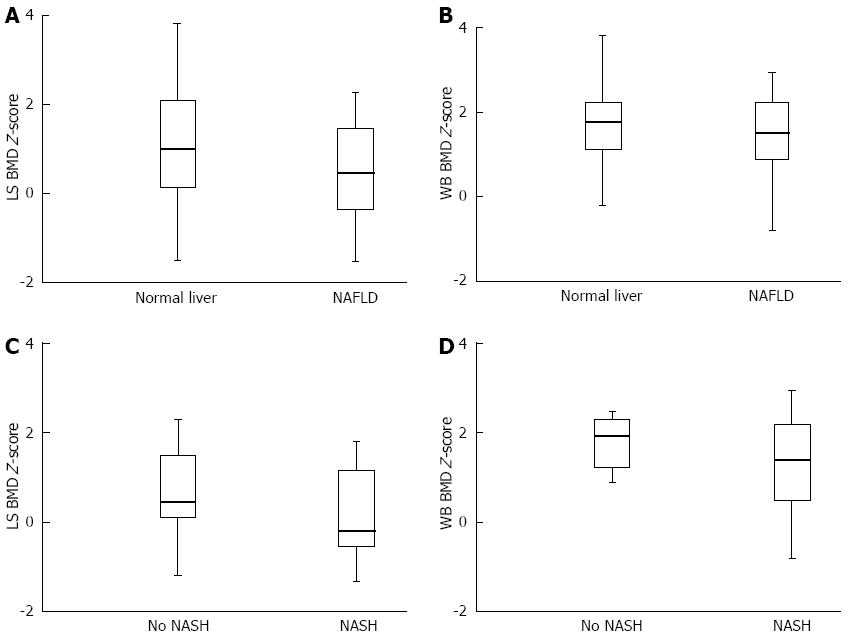
Figure 1 Bone measures.
A: Lumbar spine bone mineral density Z-score (LS BMD Z-score) for obese children with and without nonalcoholic fatty liver disease (NAFLD). Box-plots give the median value (bold), 25th and 75th percentiles (lower and upper limits of the box), and lower and upper adjacent values (whiskers); B: Whole body bone mineral density Z-score (WB BMD Z-score) for obese children with and without NAFLD. Box-plots give the median value (bold), 25th and 75th percentiles (lower and upper limits of the box), and lower and upper adjacent values (whiskers); C: LS BMD Z-score for obese children with biopsy-proven NAFLD subdivided into those with and without nonalcoholic steatohepatitis (NASH). Box-plots give the median value (bold), 25th and 75th percentiles (lower and upper limits of the box), and lower and upper adjacent values (whiskers); D: WB BMD Z-score for obese children with biopsy-proven NAFLD subdivided into those with and without NASH. Box-plots give the median value (bold), 25th and 75th percentiles (lower and upper limits of the box), and lower and upper adjacent values (whiskers).
- Citation: Pacifico L, Bezzi M, Lombardo CV, Romaggioli S, Ferraro F, Bascetta S, Chiesa C. Adipokines and C-reactive protein in relation to bone mineralization in pediatric nonalcoholic fatty liver disease. World J Gastroenterol 2013; 19(25): 4007-4014
- URL: https://www.wjgnet.com/1007-9327/full/v19/i25/4007.htm
- DOI: https://dx.doi.org/10.3748/wjg.v19.i25.4007


