Copyright
©2013 Baishideng Publishing Group Co.
World J Gastroenterol. Jun 28, 2013; 19(24): 3883-3891
Published online Jun 28, 2013. doi: 10.3748/wjg.v19.i24.3883
Published online Jun 28, 2013. doi: 10.3748/wjg.v19.i24.3883
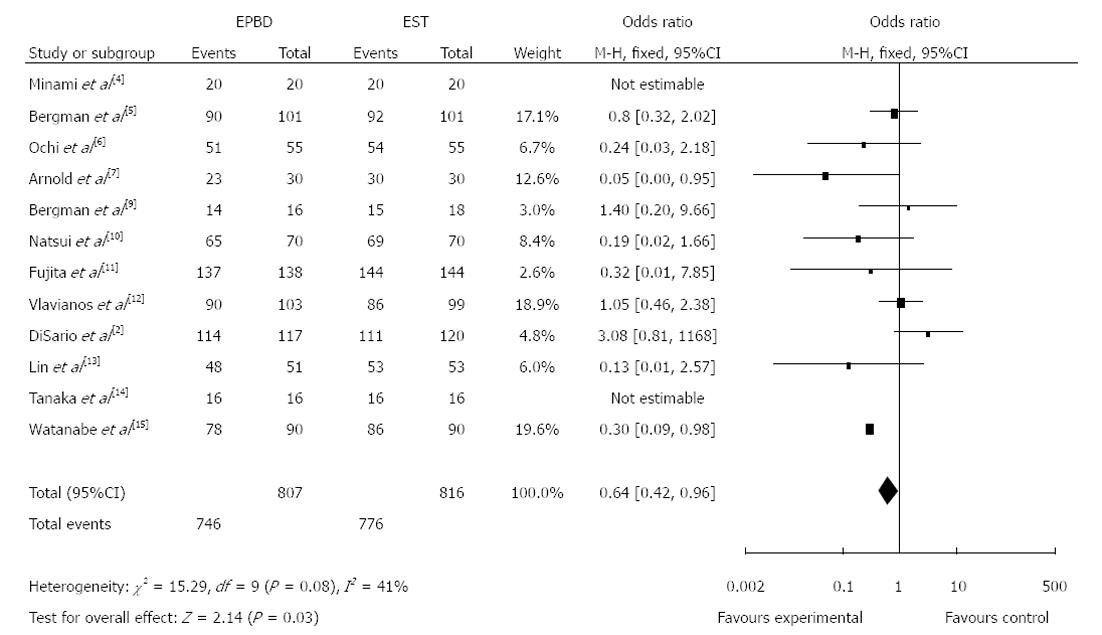
Figure 1 Comparison of total clearance of common bile duct stones between endoscopic papillary balloon dilatation (experimental group) and endoscopic sphincteropapillotomy (control group).
EPBD: Endoscopic papillary balloon dilatation; EST: Endoscopic sphincteropapillotomy.
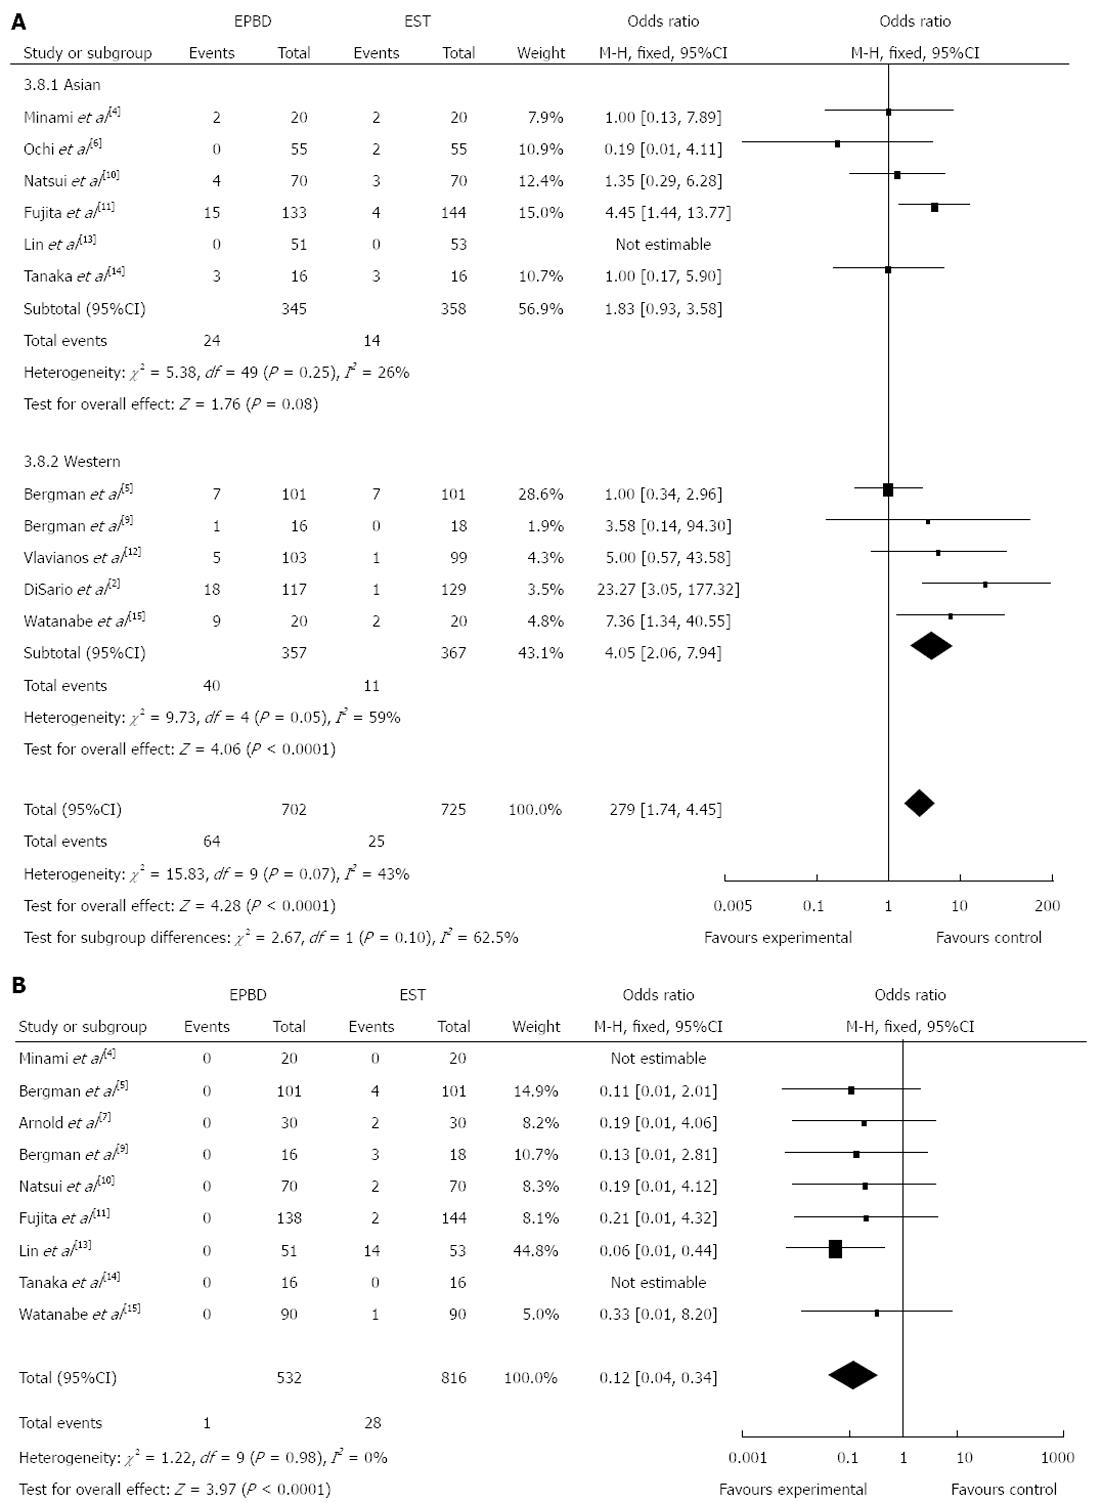
Figure 2 Incidence of pancreatitis (A) and bleeding (B) between endoscopic papillary balloon dilatation and endoscopic sphincteropapillotomy.
EPBD: Endoscopic papillary balloon dilatation; EST: Endoscopic sphincteropapillotomy.
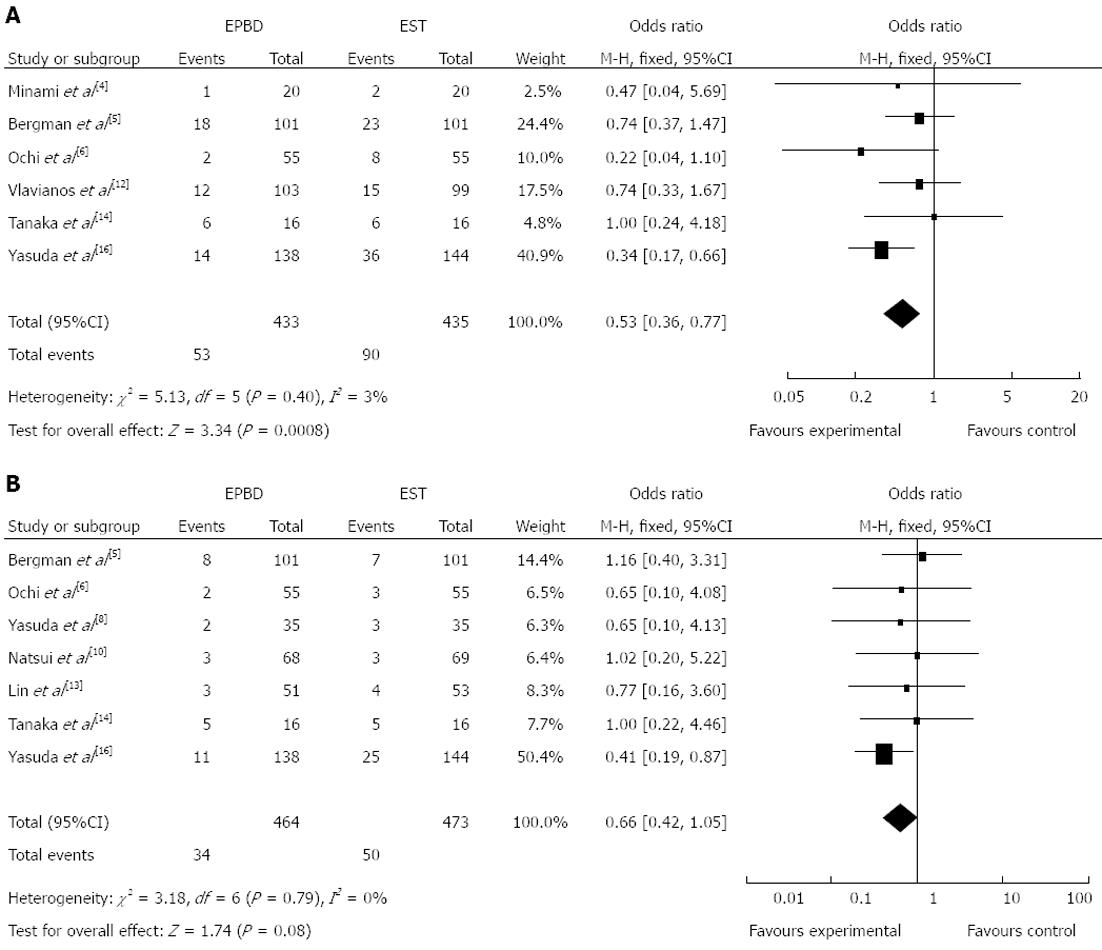
Figure 3 Overall incidence of long-term complications (A) and bile duct stone recurrence rate (B) between endoscopic papillary balloon dilatation and endoscopic sphincteropapillotomy.
EPBD: Endoscopic papillary balloon dilatation; EST: Endoscopic sphincteropapillotomy.
Figure 4 Incidence of bile duct stone recurrence rate between endoscopic papillary balloon dilatation and endoscopic sphincteropapillotomy with a follow-up of more than one year.
EPBD: Endoscopic papillary balloon dilatation; EST: Endoscopic sphincteropapillotomy.
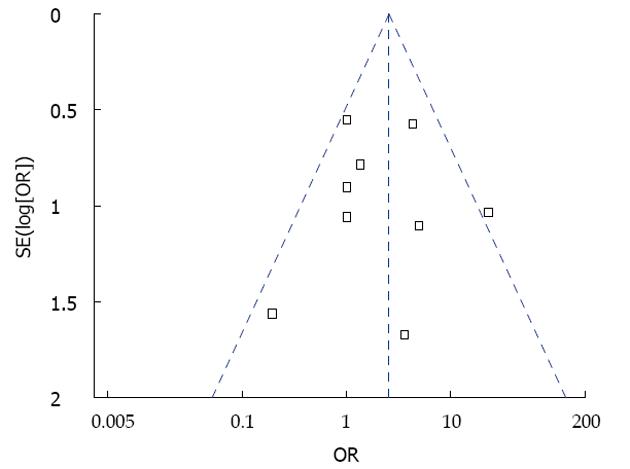
Figure 5 Funnel plot analysis of included studies.
X-axis [Peto odds ratio (OR)] represents treatment effects. Y-axis (log[Peto OR]) represents the large sample size. Each square represents an individual study. The dashed line represents 95%CI.
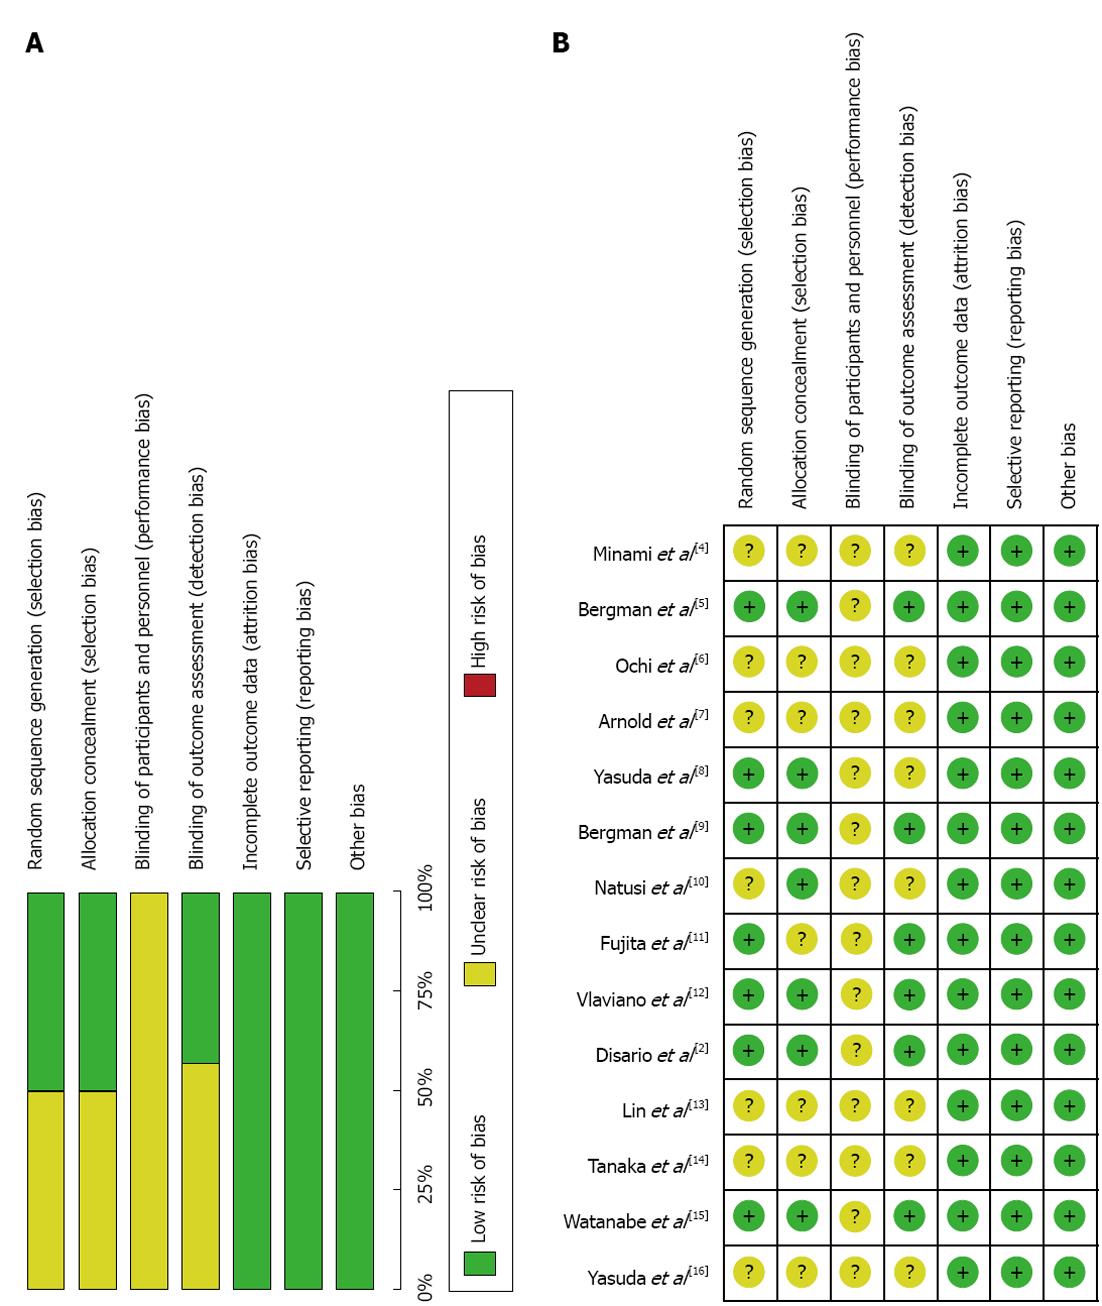
Figure 6 Risk of bias summary (A) and bias assessment for each individual study (B).
- Citation: Zhao HC, He L, Zhou DC, Geng XP, Pan FM. Meta-analysis comparison of endoscopic papillary balloon dilatation and endoscopic sphincteropapillotomy. World J Gastroenterol 2013; 19(24): 3883-3891
- URL: https://www.wjgnet.com/1007-9327/full/v19/i24/3883.htm
- DOI: https://dx.doi.org/10.3748/wjg.v19.i24.3883


