Copyright
©2013 Baishideng Publishing Group Co.
World J Gastroenterol. Jun 7, 2013; 19(21): 3263-3271
Published online Jun 7, 2013. doi: 10.3748/wjg.v19.i21.3263
Published online Jun 7, 2013. doi: 10.3748/wjg.v19.i21.3263
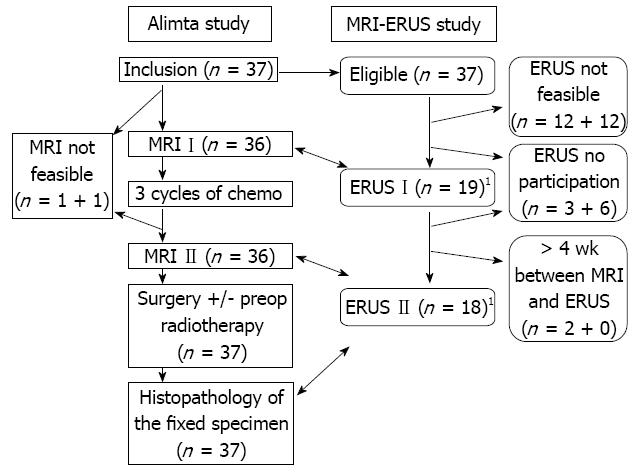
Figure 1 Study algorithm of the treatment and the examinations.
The stages and sizes using magnetic resonance imaging (MRI) were compared with the corresponding stages and sizes using endosonography (ERUS) before and after chemotherapy and with postoperative histopathology. The figure shows the assessments for size. 1Another 10 patients before chemo and 5 after chemo had complete pairs of MRI and ERUS assessments for stage.
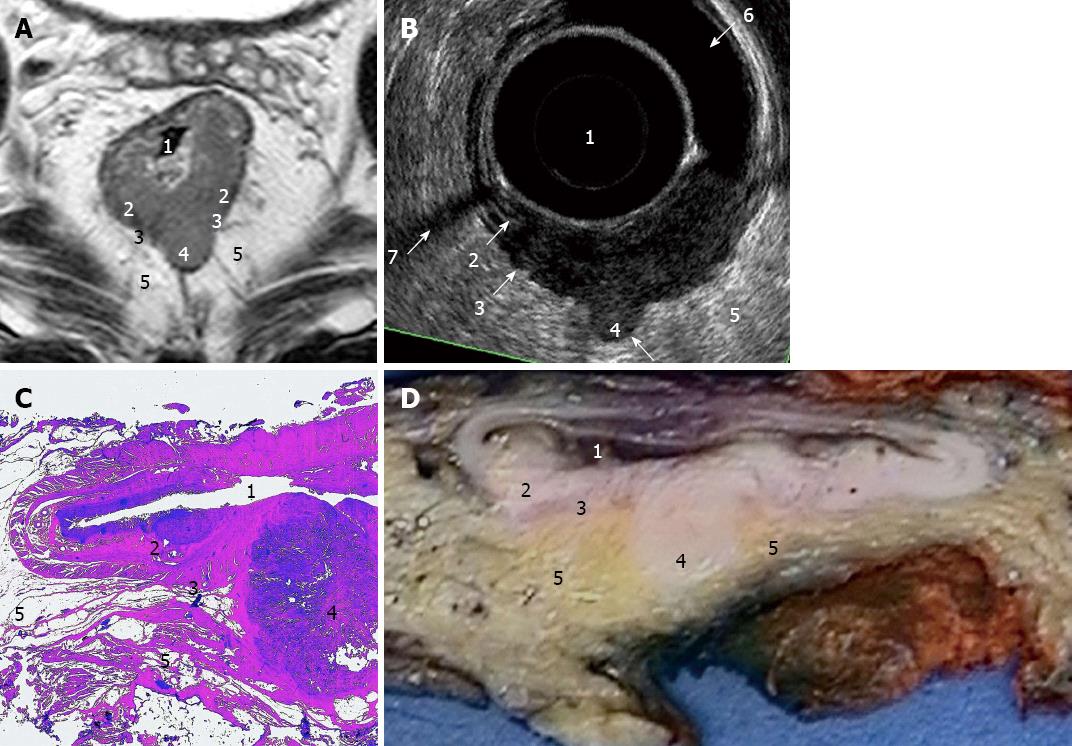
Figure 2 Images of a stage II (T3N0) rectal tumour.
The numbers denote the bowel lumen (1), the submucosal layer (2) and the interface (3) between the muscularis layer and the perirectal tissue (5) and a definite protrusion (4) through the muscularis layer. A: Magnetic resonance imaging gives a good view of the surrounding structures; B: Endosonography (ERUS) shows the bowel lumen (1) expanded by a condom filled with water and details of the bowel wall with an interruption of the submucosal layer (2). The artefacts from an air pocket (6) and some bowel remnants (7) can be a problem in ERUS; C: The histologic slice (hematoxylin and eosin staining); D: The specimen after the first part of fixation and cutting.
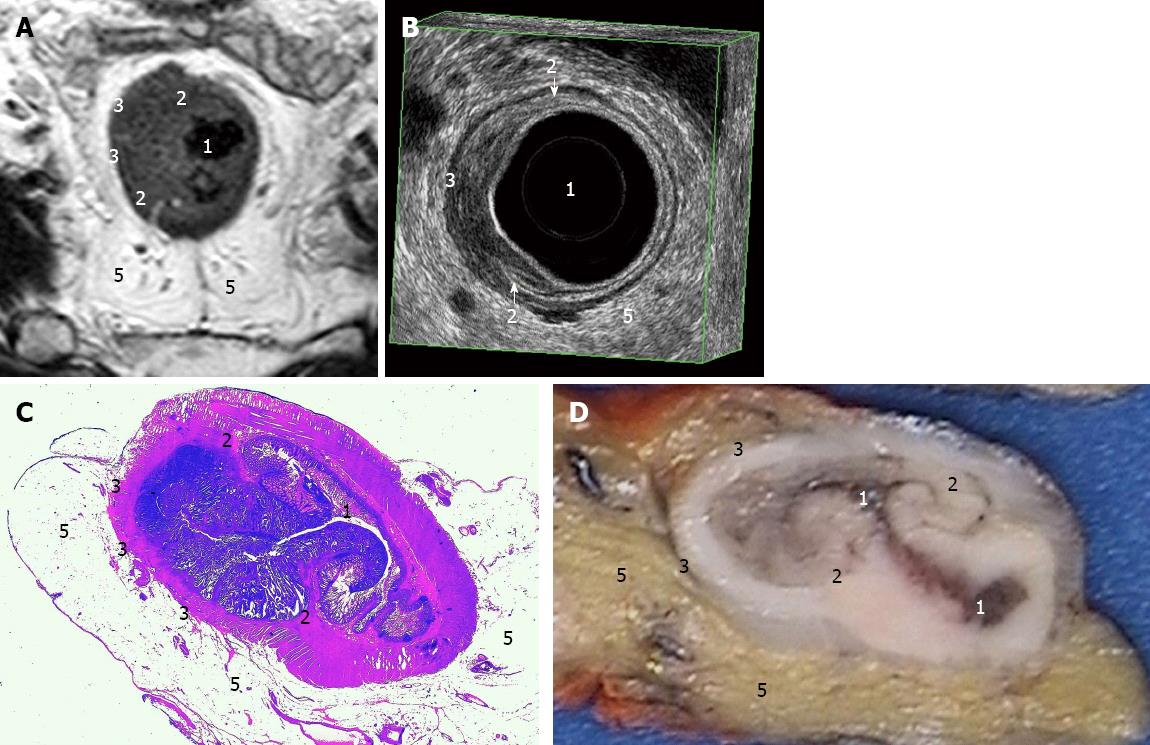
Figure 3 Images of a stage I (T2N0) rectal tumour.
The numbers denote the bowel lumen (1), the submucosal layer at its interruptions (2) and the smooth interface (3) between the muscularis layer and the perirectal tissue (5). A: Magnetic resonance imaging gives a good view of the surrounding structures; B: Endosonography shows the bowel lumen (1) expanded by the probe (the black space inside the innermost white ring) and the condom filled with water (the black space between the probe and the bowel wall). The arrows show the middle white ring corresponding to the submucosal layer (2), in this case interrupted by tumour penetration beyond the submucosa into the muscularis propria. The interface (3) between the muscularis layer and the perirectal tissue was smooth as a sign of no penetration beyond the muscularis layer; C: The histologic slice (hematoxylin and eosin staining); D: The specimen after the first part of fixation and cutting.
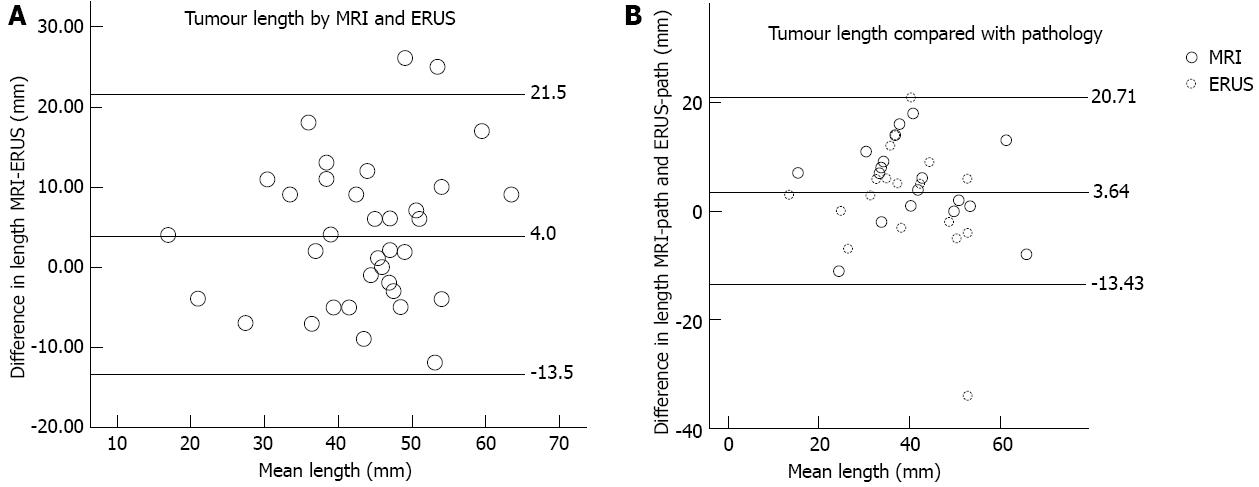
Figure 4 Measurements of supero-inferior length using magnetic resonance imaging and endosonography.
A: 37 pairs of measurements using both methods in the same patients before (19) and after (18) chemotherapy. The Bland-Altman plot illustrates the agreement between the methods. The reference lines are set at the mean difference and plus and minus 1.96 standard deviation from the mean difference; B: Measurements in 18 patients after chemotherapy compared with the resected specimens after fixation. The middle reference line shows the mean of differences in length between magnetic resonance imaging (MRI) and pathology, and endosonography (ERUS) and pathology. The outer lines show plus and minus 1.96 the mean standard deviation from the mean difference.
- Citation: Swartling T, Kälebo P, Derwinger K, Gustavsson B, Kurlberg G. Stage and size using magnetic resonance imaging and endosonography in neoadjuvantly-treated rectal cancer. World J Gastroenterol 2013; 19(21): 3263-3271
- URL: https://www.wjgnet.com/1007-9327/full/v19/i21/3263.htm
- DOI: https://dx.doi.org/10.3748/wjg.v19.i21.3263


