Copyright
©2013 Baishideng Publishing Group Co.
World J Gastroenterol. May 28, 2013; 19(20): 3018-3026
Published online May 28, 2013. doi: 10.3748/wjg.v19.i20.3018
Published online May 28, 2013. doi: 10.3748/wjg.v19.i20.3018
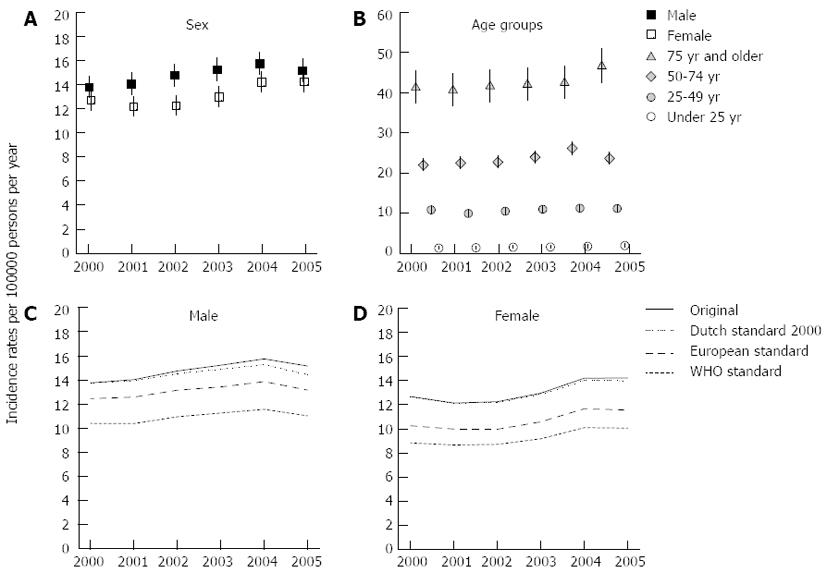
Figure 1 Incidence rates acute pancreatitis per 100000 persons per year.
A: The incidence rates of male and female acute pancreatitis (AP) cases; B: The incidence rates for four major age groups (< 25, 25-49, 50-74 and > 74 years); C (males) and D (females): The original as well as the Dutch 2000, the European and the World Health Organization (WHO) standardized incidence rates of AP.
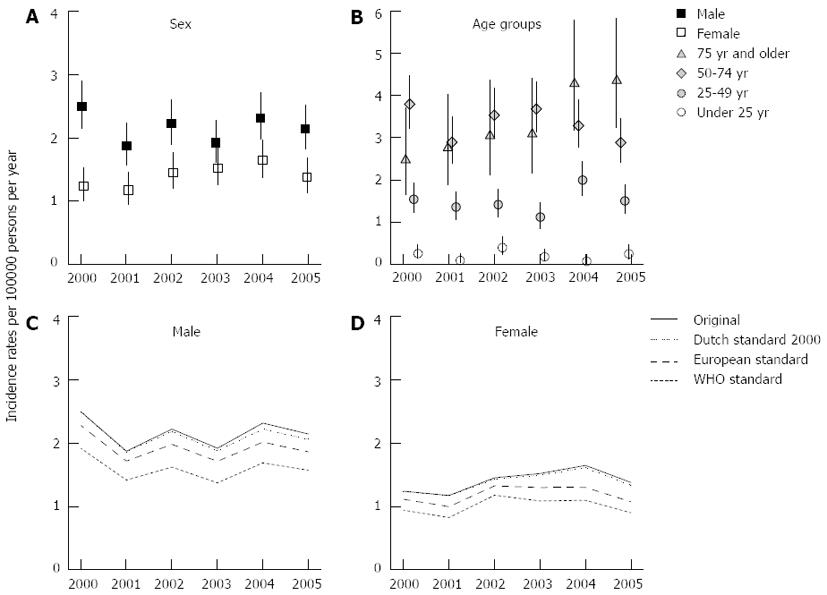
Figure 2 Incidence rates chronic pancreatitis per 100000 persons per year.
A: The incidence rates of male and female chronic pancreatitis (CP) cases; B: The incidence rates for four major age groups (< 25, 25-49, 50-74 and > 74 years); C (males) and D (females): The original as well as the Dutch 2000, the European and the World Health Organization (WHO) standardized incidence rates of CP.
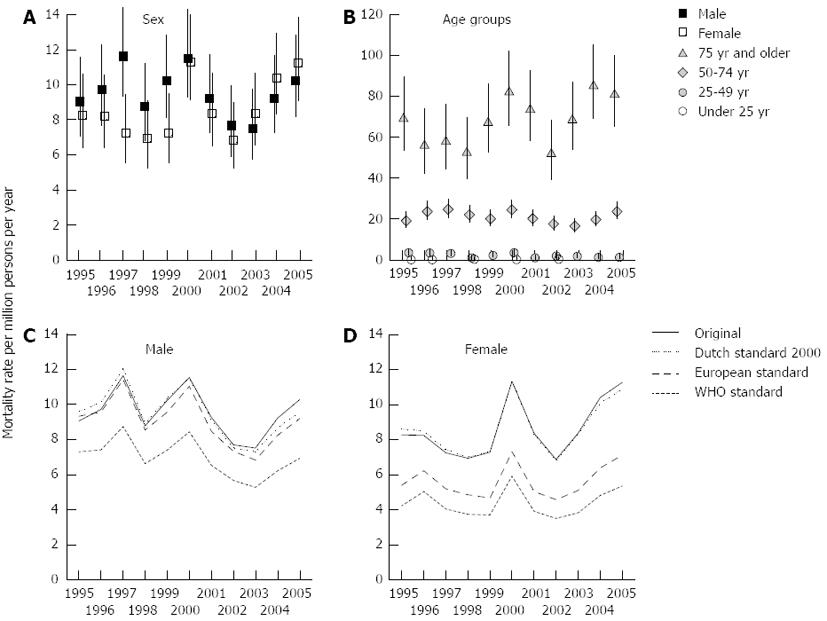
Figure 3 Mortality rates acute pancreatitis per million persons per year.
A: The male and female mortality rates of acute pancreatitis (AP) for 1995-2005; B: The mortality rates for four major age groups (< 25, 25-49, 50-74 and > 74 years); C (males) and D (females): The original as well as the Dutch 2000, the European and the World Health Organization (WHO) standardized mortality rates of AP.
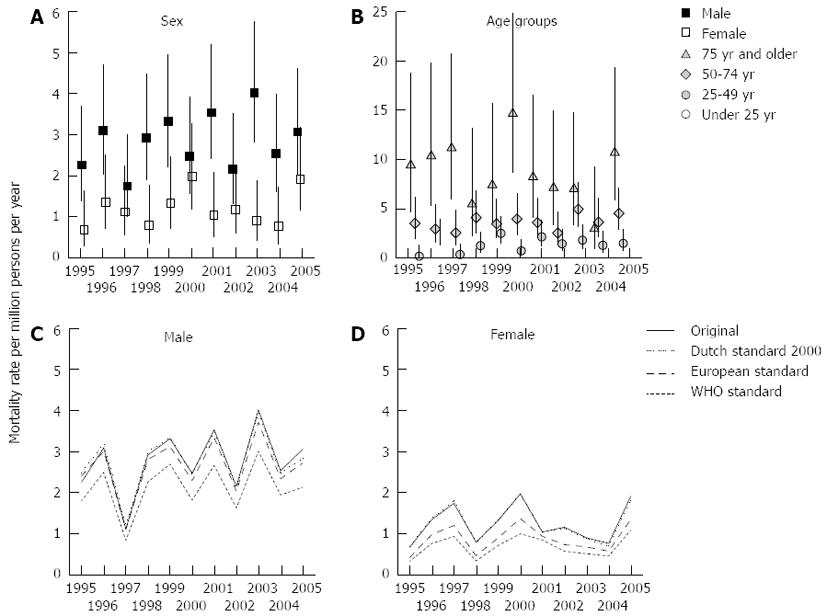
Figure 4 Mortality rates chronic pancreatitis per million persons per year.
A: The male and female mortality rates of chronic pancreatitis (CP) for 1995-2005; B: The mortality rates for four major age groups (< 25, 25-49, 50-74 and > 74 years); C (males) and D (females): The original as well as the Dutch 2000, the European and the World Health Organization (WHO) standardized mortality rates of CP for 1995-2005.
- Citation: Spanier BM, Bruno MJ, Dijkgraaf MG. Incidence and mortality of acute and chronic pancreatitis in the Netherlands: A nationwide record-linked cohort study for the years 1995-2005. World J Gastroenterol 2013; 19(20): 3018-3026
- URL: https://www.wjgnet.com/1007-9327/full/v19/i20/3018.htm
- DOI: https://dx.doi.org/10.3748/wjg.v19.i20.3018


