Copyright
©2013 Baishideng Publishing Group Co.
World J Gastroenterol. Jan 14, 2013; 19(2): 284-289
Published online Jan 14, 2013. doi: 10.3748/wjg.v19.i2.284
Published online Jan 14, 2013. doi: 10.3748/wjg.v19.i2.284
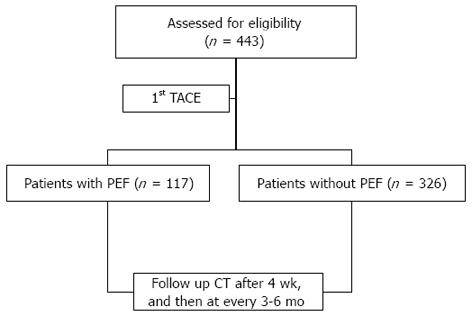
Figure 1 Flowchart of study patient enrollment.
PEF: Postembolization fever; TACE: Transcatheter arterial chemoembolization; CT: Computed tomography.
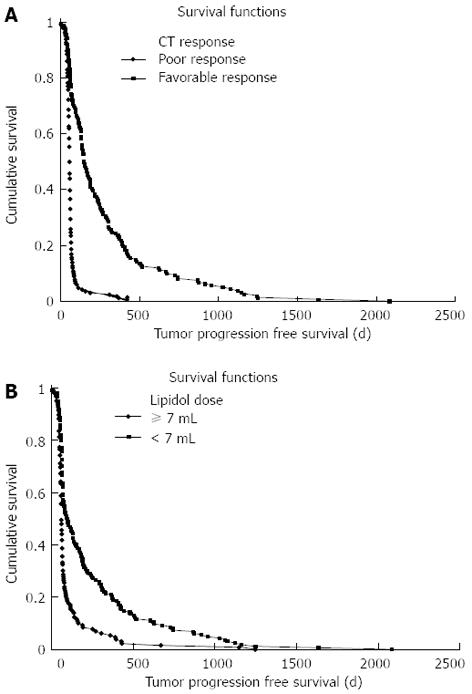
Figure 2 Kaplan-Meier curves of progression-free survival.
A: According to computed tomography response (log-rank test, P < 0.001); B: According to lipiodol dose (log-rank test, P < 0.001).
- Citation: Jun CH, Ki HS, Lee HK, Park KJ, Park SY, Cho SB, Park CH, Joo YE, Kim HS, Choi SK, Rew JS. Clinical significance and risk factors of postembolization fever in patients with hepatocellular carcinoma. World J Gastroenterol 2013; 19(2): 284-289
- URL: https://www.wjgnet.com/1007-9327/full/v19/i2/284.htm
- DOI: https://dx.doi.org/10.3748/wjg.v19.i2.284


