Copyright
©2013 Baishideng Publishing Group Co.
World J Gastroenterol. May 14, 2013; 19(18): 2811-2817
Published online May 14, 2013. doi: 10.3748/wjg.v19.i18.2811
Published online May 14, 2013. doi: 10.3748/wjg.v19.i18.2811
Figure 1 Box plot of preoperative mean corpuscular volume stratified by preoperative red blood cell count (A), gender (B) and body mass index (C).
MCV: Mean corpuscular volume; BMI: Body mass index.
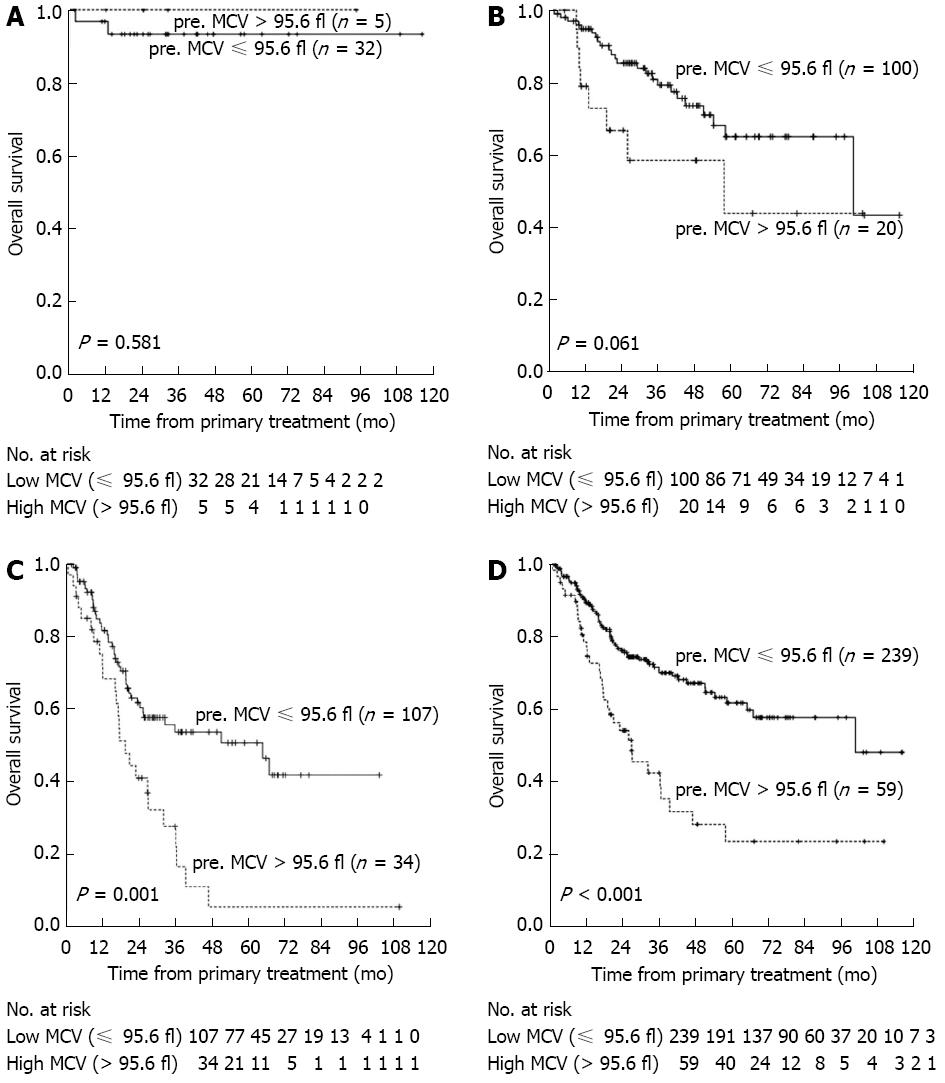
Figure 2 Kaplan-Meier estimates of the probability of overall survival according to preoperative mean corpuscular volume in stage I cohort (A), stage II cohort (B), stage III cohort (C), and all cohorts (D).
pre. MCV: Preoperative mean corpuscular volume.
- Citation: Zheng YZ, Dai SQ, Li W, Cao X, Li Y, Zhang LJ, Fu JH, Wang JY. Prognostic value of preoperative mean corpuscular volume in esophageal squamous cell carcinoma. World J Gastroenterol 2013; 19(18): 2811-2817
- URL: https://www.wjgnet.com/1007-9327/full/v19/i18/2811.htm
- DOI: https://dx.doi.org/10.3748/wjg.v19.i18.2811


