Copyright
©2013 Baishideng Publishing Group Co.
World J Gastroenterol. May 7, 2013; 19(17): 2660-2667
Published online May 7, 2013. doi: 10.3748/wjg.v19.i17.2660
Published online May 7, 2013. doi: 10.3748/wjg.v19.i17.2660
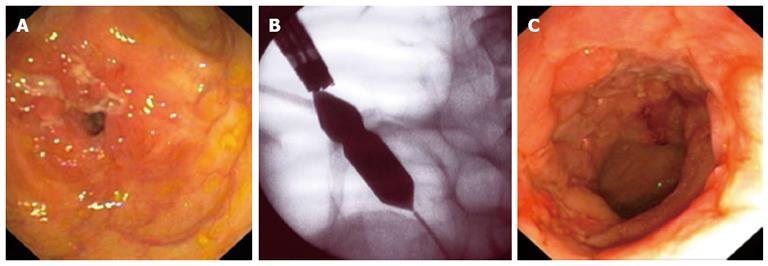
Figure 1 Images of Crohn’s disease-related stricture in one patient.
A: Direct visualization of the ileal stricture; B: Inflation of the endoscopic balloon under fluoroscopic control; C: Direct visualization of the bowel site after the endoscopic balloon dilation.
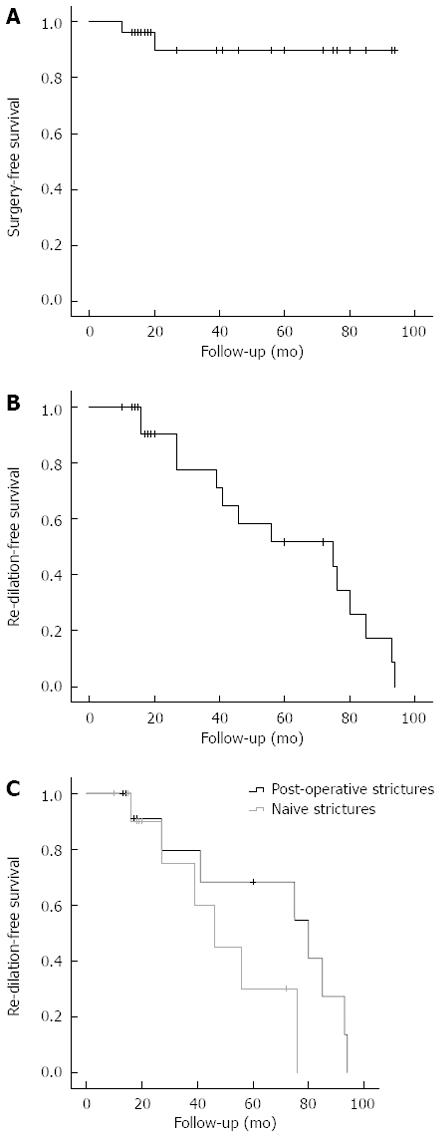
Figure 2 Kaplan-Meier curves for intervals free of surgery or endoscopic dilation.
A: Kaplan-Meier curve for interval free of surgery after endoscopic balloon dilation or re-dilation; B: Kaplan-Meier curve for interval free of re-dilation during the follow-up period; C: Kaplan-Meier curve for the interval free of re-dilation over the follow-up period for patients with naive (in gray) and post-operative (in black) strictures.
- Citation: de’Angelis N, Carra MC, Borrelli O, Bizzarri B, Vincenzi F, Fornaroli F, De Caro G, de’Angelis GL. Short- and long-term efficacy of endoscopic balloon dilation in Crohn’s disease strictures. World J Gastroenterol 2013; 19(17): 2660-2667
- URL: https://www.wjgnet.com/1007-9327/full/v19/i17/2660.htm
- DOI: https://dx.doi.org/10.3748/wjg.v19.i17.2660


