Copyright
©2013 Baishideng Publishing Group Co.
World J Gastroenterol. May 7, 2013; 19(17): 2621-2628
Published online May 7, 2013. doi: 10.3748/wjg.v19.i17.2621
Published online May 7, 2013. doi: 10.3748/wjg.v19.i17.2621
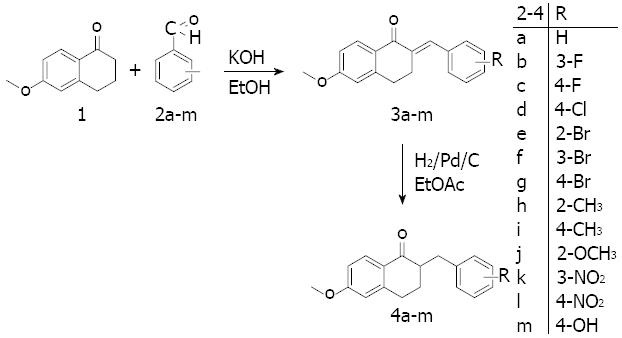
Figure 1 Outline of the procedure for the synthesis of the tetralones.
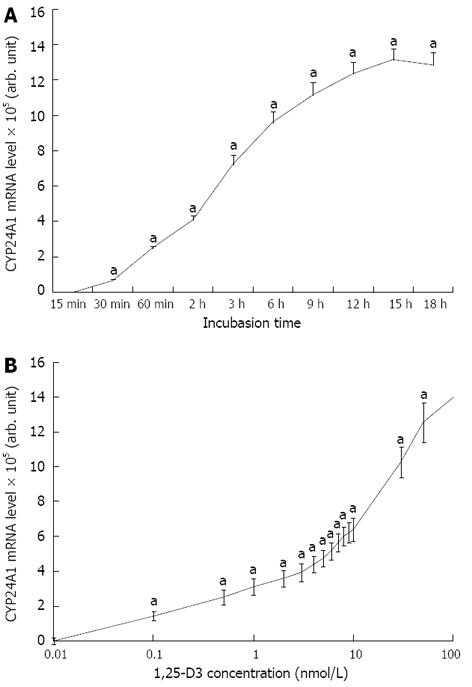
Figure 2 Time and dose dependent-changes in CYP24A1 mRNA expression in response to 1,25-D3 administration.
A: Time course of changes in the cytochrome P450 component of the 25-hydroxyvitamin D3-24-hydroxylase (CYP24A1) mRNA expression in Caco-2 cells after the addition of 100 nmol/L active vitamin D3 metabolite 1,25-dihydroxyvitamin D3 (1,25-D3) to the cell culture supernatant. Glyceraldehyde-3-phosphate dehydrogenase (GAPDH)-normalized CYP24A1 expression levels are shown as a percentage of the CYP24A1 level of the untreated control cells. Points indicate means ± standard deviation (SD) (aP < 0.05 vs untreated control); B: Dose-dependent changes in CYP24A1 mRNA levels in Caco-2 cells after the addition of different amounts of 1,25-D3. GAPDH-normalized CYP24A1 expression levels are shown as a percentage of the CYP24A1 level of the untreated control cells. Points indicate means ± SD (aP < 0.05 vs untreated control).
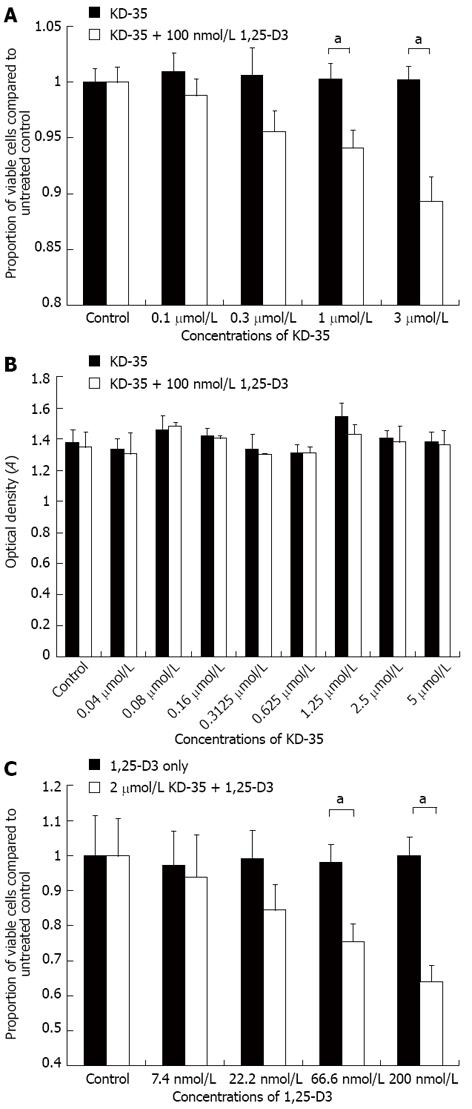
Figure 3 Cell proliferation, lactate dehydrogenase activity and proliferation studies in the presence of KD-35 and 1,25-D3.
A: Changes in the number of viable Caco-2 cells (sulforhodamine-B staining) in the presence of different concentrations of KD-35. Selected wells were treated with 100 nmol/L active 1,25-D3. Data are means ± SD (aP < 0.05 between KD-35 and KD-35 + 1,25-D3 treated cells); B: Changes in the lactate dehydrogenase (LDH) activity of the cell culture supernatant in response to KD-35 with or without 1,25-D3. Data are means ± SD. No significant changes in LDH activity were seen after treatment; C: Changes in the proliferation of Caco-2 cells (5-bromo-2’-deoxyuridine incorporation) in response to different concentrations of 1,25-D3. White bars indicate combined treatment with the given 1,25-D3 concentration + 2 μmol/L KD-35. Data are means ± SD. Significance levels were calculated between each sample and the untreated control sample (aP < 0.05 between 1,25-D3 and 1,25-D3 + KD-35 treated cells).
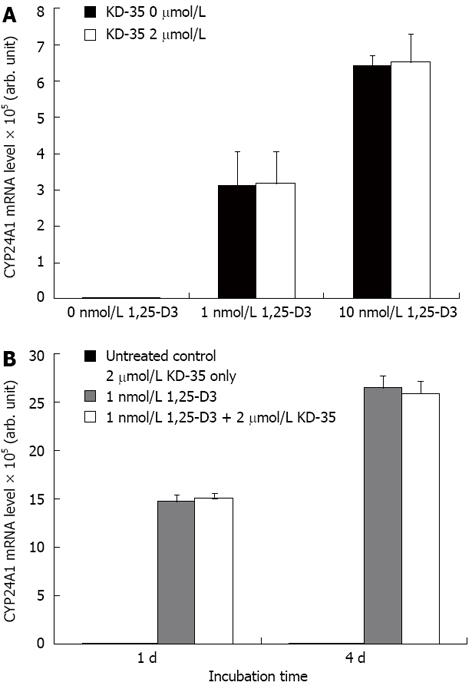
Figure 4 KD-35 has no effect on CYP24A1 mRNA expression.
A: Changes in CYP24A1 mRNA levels in Caco-2 cells incubated with different concentrations of 1,25-D3 for 4 h with or without KD-35. Data are means ± SD. No significant changes in mRNA levels were seen with or without KD-35; B: Effects of KD-35 and KD-35 + 1,25-D3 on CYP24A1 mRNA expression in Caco-2 cells. Data are means ± SD. No significant change in mRNA levels was seen with or without KD-35 at any time point.
- Citation: Kósa JP, Horváth P, Wölfling J, Kovács D, Balla B, Mátyus P, Horváth E, Speer G, Takács I, Nagy Z, Horváth H, Lakatos P. CYP24A1 inhibition facilitates the anti-tumor effect of vitamin D3 on colorectal cancer cells. World J Gastroenterol 2013; 19(17): 2621-2628
- URL: https://www.wjgnet.com/1007-9327/full/v19/i17/2621.htm
- DOI: https://dx.doi.org/10.3748/wjg.v19.i17.2621


