Copyright
©2013 Baishideng Publishing Group Co.
World J Gastroenterol. Apr 14, 2013; 19(14): 2234-2241
Published online Apr 14, 2013. doi: 10.3748/wjg.v19.i14.2234
Published online Apr 14, 2013. doi: 10.3748/wjg.v19.i14.2234
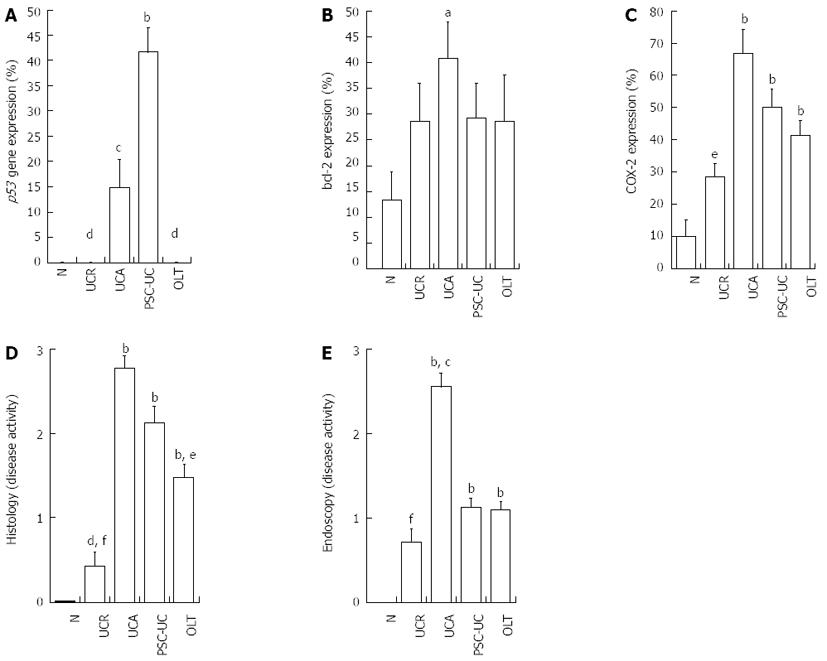
Figure 1 Comparison of findings in percent (%) in all tested group.
A: Comparison of intranuclear p53 gene expression in percent (%) in all tested group; B: Comparison of bcl-2 expression in percent (%) in all tested group; C: Comparison of COX-2 expression by immunohistochemistry in percent (%) in all tested group; D: Comparison of inflammatory disease activity by histology (0 = nonactive, 1 = mild, 2 = moderate, 3 = severe) in all tested group; E: Comparison of endoscopic findings by Mayo score in all tested group in all tested group. The bars with error bars represent group means with SEM. Differences between groups were evaluated using Dunn’s multiple comparisons with Bonferroni correction. aP < 0.05, bP < 0.01 vs N group; cP < 0.05, dP < 0.01 vs PSC-UC group; eP < 0.05, fP < 0.01 vs UCA group. UC: Ulcerative colitis; UCR: UC in remission; PSC: Primary sclerosing cholangitis; OLT: UC after liver transplantation for PSC; UCA: UC active disease; COX-2: Cyclooxygenase-2.
- Citation: Wohl P, Hucl T, Drastich P, Kamenar D, Spicak J, Honsova E, Sticova E, Lodererova A, Matous J, Hill M, Wohl P, Kucera M. Epithelial markers of colorectal carcinogenesis in ulcerative colitis and primary sclerosing cholangitis. World J Gastroenterol 2013; 19(14): 2234-2241
- URL: https://www.wjgnet.com/1007-9327/full/v19/i14/2234.htm
- DOI: https://dx.doi.org/10.3748/wjg.v19.i14.2234


