Copyright
©2012 Baishideng Publishing Group Co.
World J Gastroenterol. Mar 7, 2012; 18(9): 979-985
Published online Mar 7, 2012. doi: 10.3748/wjg.v18.i9.979
Published online Mar 7, 2012. doi: 10.3748/wjg.v18.i9.979
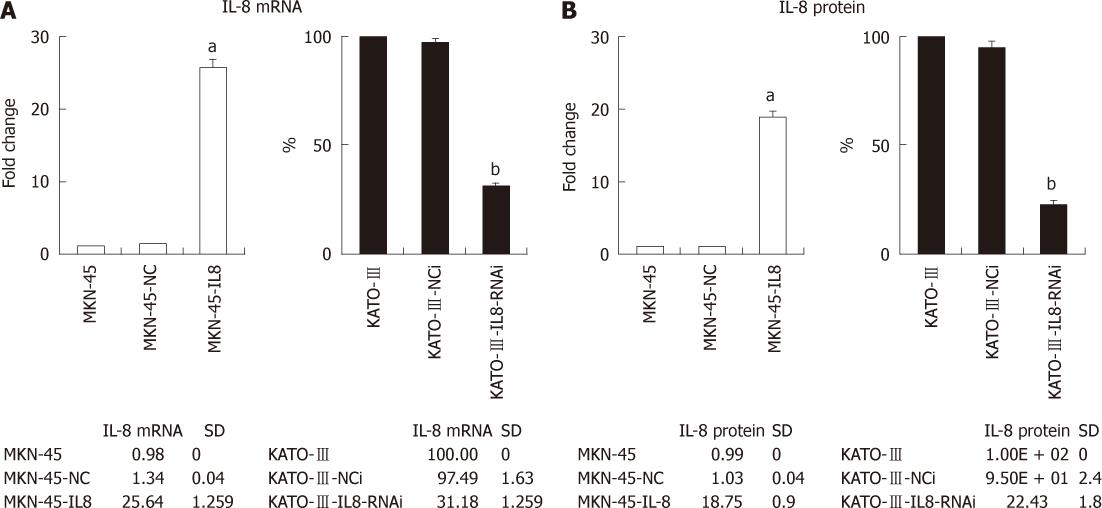
Figure 1 Interleukin-8 expression of gastric cancer cells.
A: Real-time polymerase chain reaction determined the level of Interleukin-8 (IL-8) mRNA in gastric cancer (GC) cells. Expression levels were determined by the ΔΔCt method using glyceraldehyde-3-phosphate dehydrogenase as endogenous control. Histograms show fold change over the relative expression levels of IL-8 mRNA of control cells. Each bar represents the mean ± SD (aP < 0.05 vs MKN-45, bP < 0.05 vs KATO-III); B: IL-8 production in GC cells measured by enzyme-linked immunosorbent assay. Histograms show fold change in the relative expression levels of IL-8 protein of control cells. All experiments were repeated three times with similar results. Each bar represents the mean ± SD (aP < 0.05 vs MKN-45, bP < 0.05 vs KATO-III).
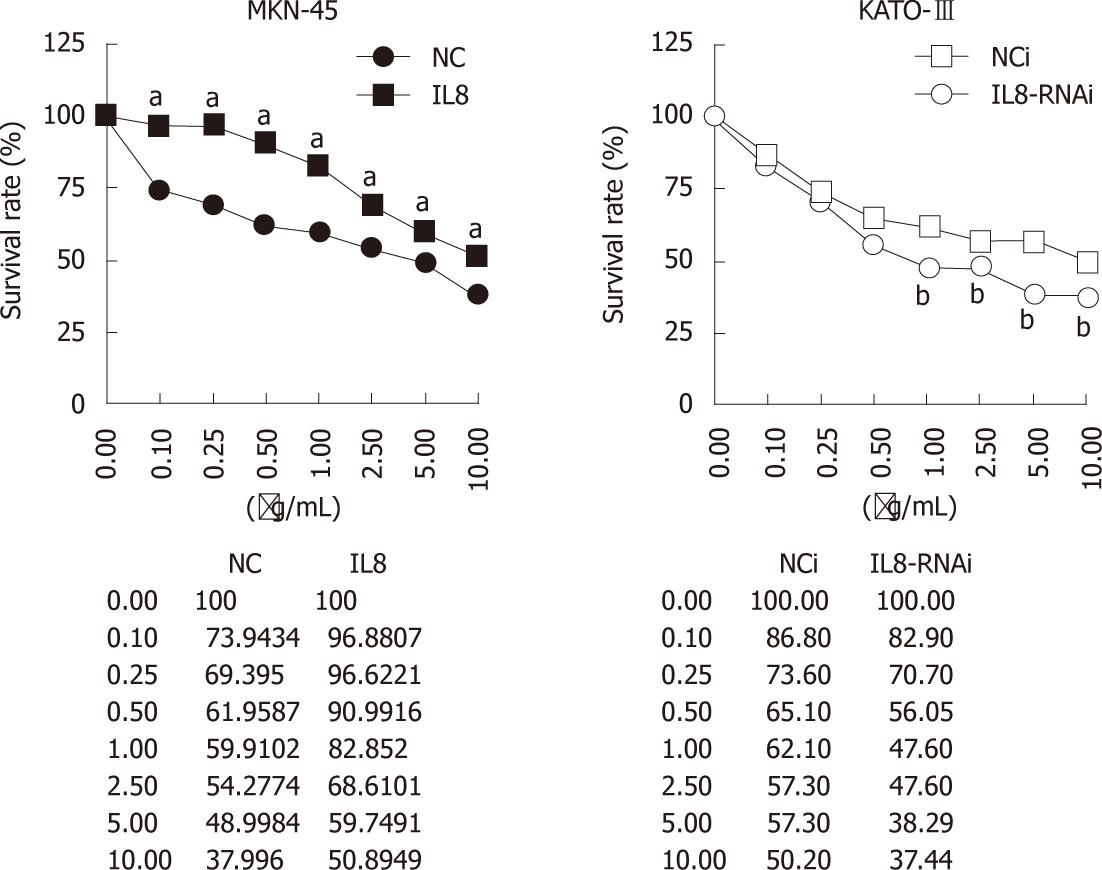
Figure 2 Growth inhibition assay of gastric cancer cells treated with oxaliplatin.
Survival of gastric cancer cells is tested by 3-(4,5-cimethylthiazol-2-yl)-2,5-diphenyl tetrazolium bromide assay. Each bar represents the mean ± SD. All experiments were repeated three times with similar results (aP < 0.05 vs MKN-45-NC, bP < 0.05 vs KATO-III-NCi).
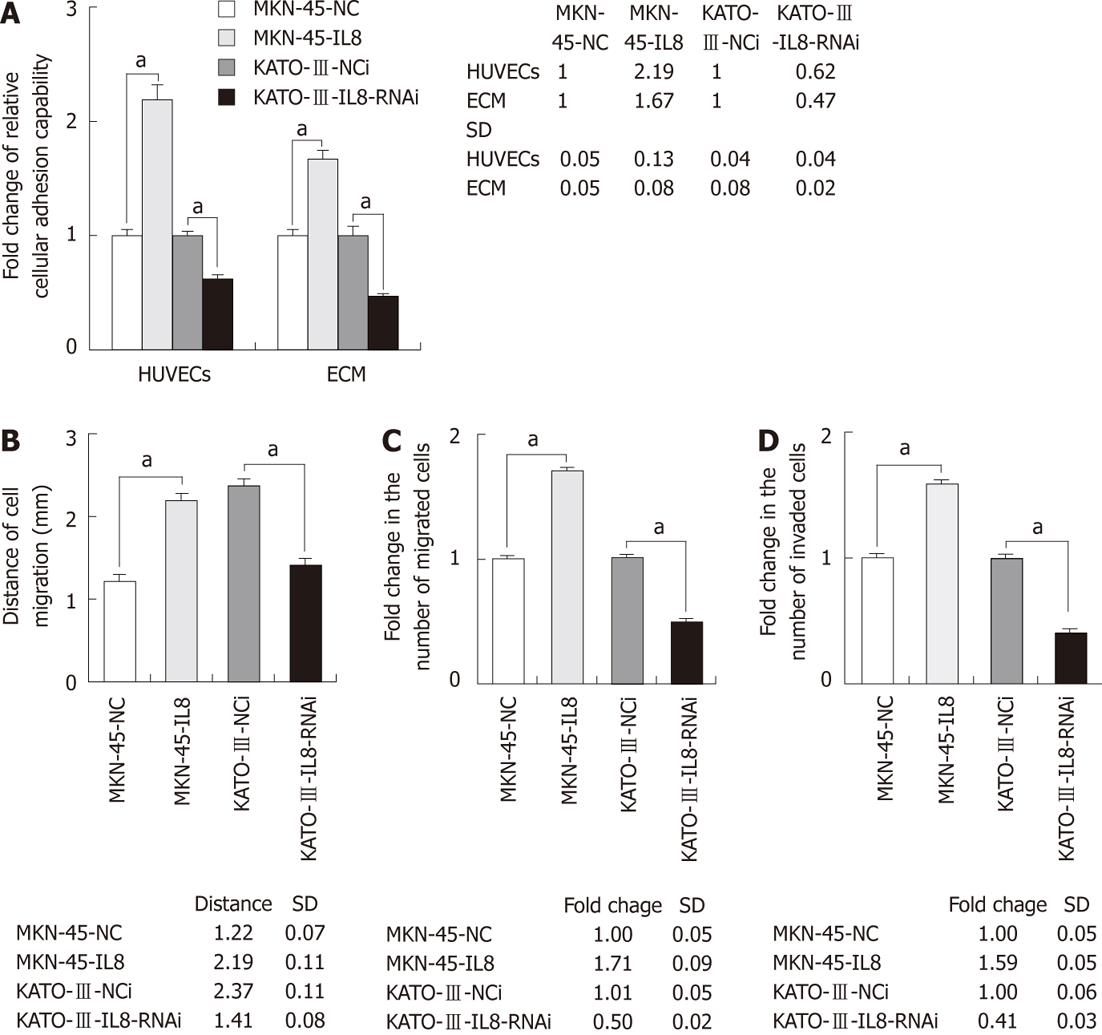
Figure 3 Interleukin-8 involved in gastric cancer cell adhesion, migration and invasion.
A: Effect of Interleukin-8 (IL-8) on gastric cancer (GC) cell adhesion to human endothelial cells and extracellular matrix components. Histograms show fold change in the relative OD value of control cells quantified by cell proliferation assay to calculate the mean cellular adhesion capability; B: Effect of IL-8 on GC cell migration tested by wound-healing assays. Histograms show distances of cell migration; C: Effect of IL-8 on GC cell migration tested by Transwell assays. Histograms show fold change in the number of migrated cells vs the control cells; D: Effect of IL-8 on GC cell invasion. Histograms show fold change in the number of invaded cells vs the control cells. Each bar represents the mean ± SD. All experiments were repeated three times with similar results (aP < 0.05). HUVEC: Human umbilical vein endothelial cell.
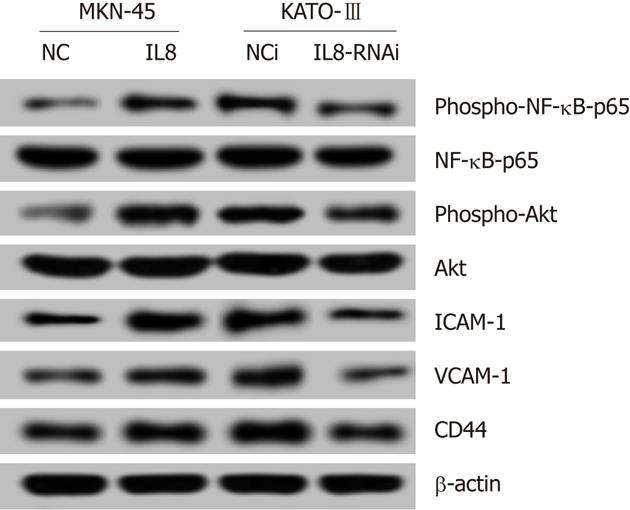
Figure 4 Effect of Interleukin-8 on NF-κB and Akt activities and adhesion molecules ICAM-1 and VCAM-1, and CD44 expression in gastric cancer cells.
The protein expression levels of phospho-NF-κB-p65, NF-κB-p65, phospho-Akt, Akt, ICAM-1, VCAM-1, and CD44 were determined by Western blotting. All experiments were repeated three times with similar results.
- Citation: Kuai WX, Wang Q, Yang XZ, Zhao Y, Yu R, Tang XJ. Interleukin-8 associates with adhesion, migration, invasion and chemosensitivity of human gastric cancer cells. World J Gastroenterol 2012; 18(9): 979-985
- URL: https://www.wjgnet.com/1007-9327/full/v18/i9/979.htm
- DOI: https://dx.doi.org/10.3748/wjg.v18.i9.979


