Copyright
©2012 Baishideng Publishing Group Co.
World J Gastroenterol. Mar 7, 2012; 18(9): 915-922
Published online Mar 7, 2012. doi: 10.3748/wjg.v18.i9.915
Published online Mar 7, 2012. doi: 10.3748/wjg.v18.i9.915
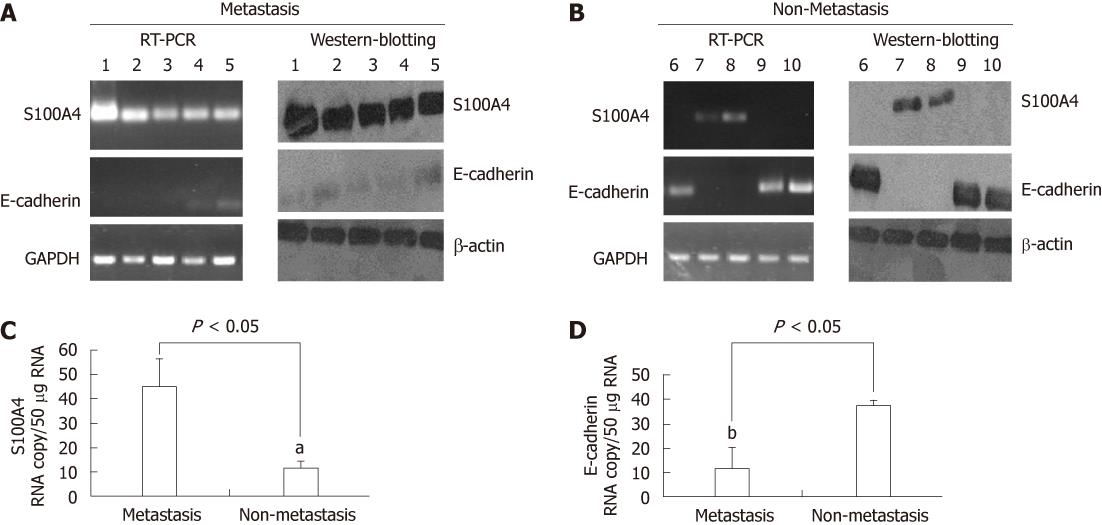
Figure 1 S100A4 and E-cadherin expression in metastasis and non-metastasis tissue.
A: The representive reverse transcription-polymerase chain reaction (RT-PCR) and Western blotting results for S100A4 and E-cadherin in metastasis tissue; B: The representive RT-PCR and Western blotting results for S100A4 and E-cadherin in non-metastasis tissue; C and D: Levels of transcripts of S100A4 and E-cadherin in M tumor samples in comparison to N tumor (expressed as transcript copynumber per 50 μg of messenger RNA and standardized with β-actin). The intensity of each band relative to the glyceraldehyde-3-phosphate dehydrogenase (GAPDH) (α-tubulin) band was represented as the mean ± SD, aP < 0.05 vs metastasis group and bP < 0.05 vs non-metastasis group.
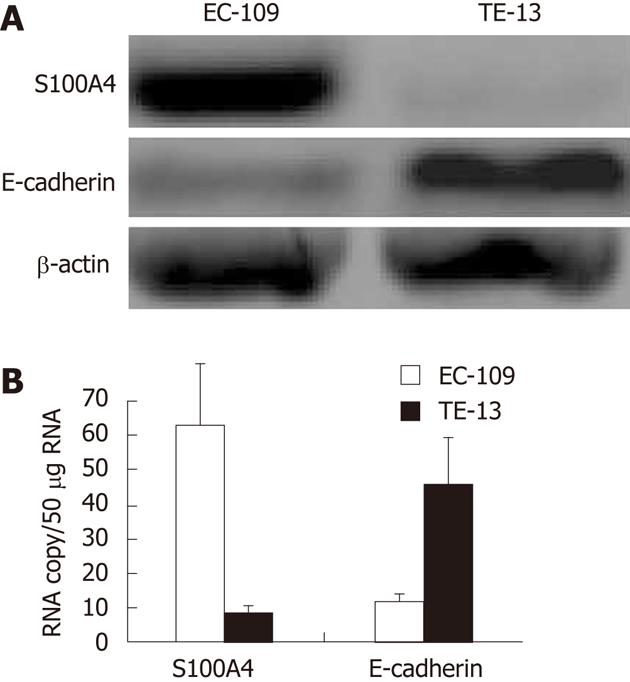
Figure 2 Analysis for S100A4 and E-cadherin in EC109 and TE13 cell lines.
A: Western blotting analysis for S100A4 and E-cadherin in EC109 and TE13 cell lines; B: Reverse transcription-polymerase chain reaction analysis for S100A4 and E-cadherin in EC109 and TE13 cell lines. The levels of S100A4 were significantly higher in EC109 cells than that of in TE13 cells, and the levels of E-cadherin were significantly lower in EC109 cells than that of in TE13 cells.
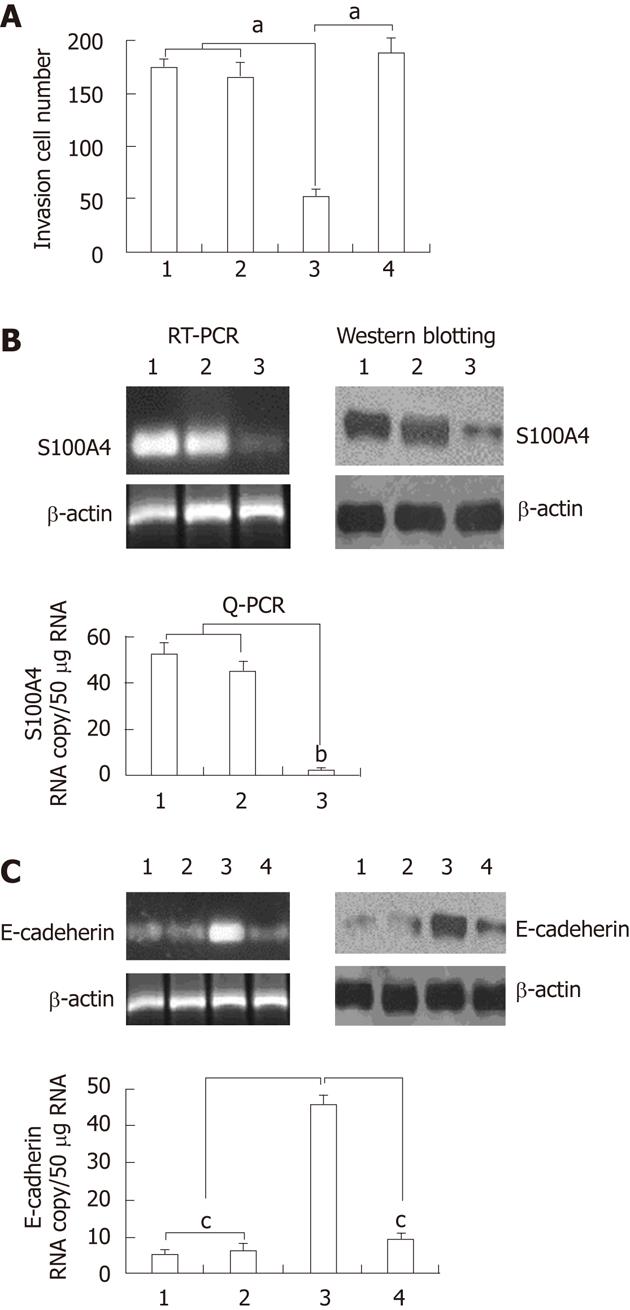
Figure 3 Knockdown of S100A4 inhibits invasive capability of EC109 cells.
A: Transmigration cells of control, mock siRNA, S100A4 siRNA and S100A4 siRNA + S100A4 cDNA cells was calculated from three independent experiments. The indicated cells (1 × 10⁴) were seeded on 8-mm porous transwell chambers. After 24 h of plating, transmigration cells were fixed and stained with crystal violet. Transmigration cells were counted for each of the indicated cells. Columns, mean number of cells obtained in three independent experiments; bars, SD; aP < 0.05 vs control or mock siRNA group; B: Western blotting, reverse transcription-polymerase chain reaction (RT-PCR) and quantitative real time PCR (Q-PCR) analysis for S100A4 and mRNA and protein expression, bP < 0.05 vs control or mock siRNA group; C: Western blotting, RT-PCR and Q-PCR analysis for E-cadherin and mRNA and protein expression. cP < 0.05 vs S100A4 siRNA group. 1: Control; 2: Mock siRNA; 3: S100A4 siRNA; 4: S100A4 siRNA + E-cadherin siRNA.
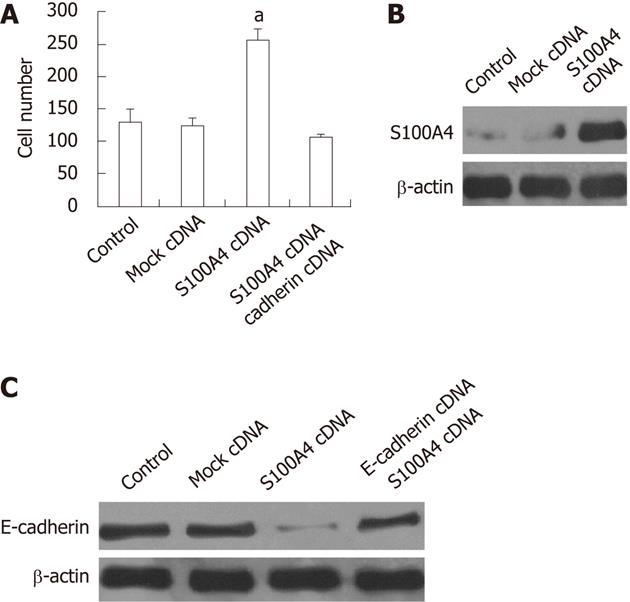
Figure 4 S100A4 overexpression promotes invasive capability of TE13 cells.
A: Transmigration cells of control, mock cDNA, S100A4 cDNA and S100A4 cDNA + E-cadherin cDNA cells was calculated from three independent experiments. The indicated cells (1 × 10⁴) were seeded on 8-mm porous transwell chambers. After 24 h of plating, transmigration cells were fixed and stained with crystal violet. Transmigration cells were counted for each of the indicated cells. Columns, mean number of cells obtained in three independent experiments; bars, SD; aP < 0.05 vs other 3 groups respectively; B: Western blotting, analysis for S100A4 protein expression; C: Western blotting analysis for E-cadherin protein expression.
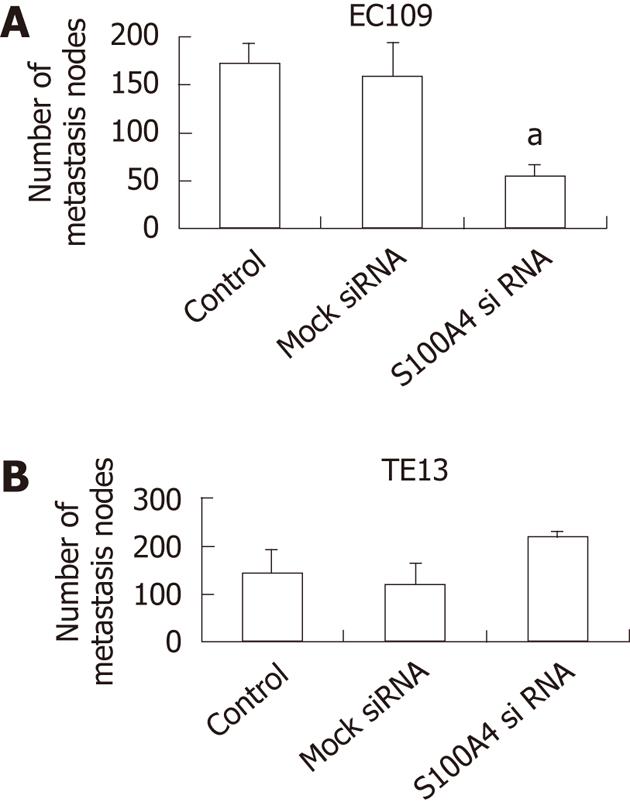
Figure 5 Knockdown of S100A4 inhibits metastasis of xenograft tumors (n = 6 per group).
A: The total metastasis nodes in EC109 tumors (aP < 0.05 vs control or mock siRNA); B: The metastasis nodes in TE13 tumors.
- Citation: Chen D, Zheng XF, Yang ZY, Liu DX, Zhang GY, Jiao XL, Zhao H. S100A4 silencing blocks invasive ability of esophageal squamous cell carcinoma cells. World J Gastroenterol 2012; 18(9): 915-922
- URL: https://www.wjgnet.com/1007-9327/full/v18/i9/915.htm
- DOI: https://dx.doi.org/10.3748/wjg.v18.i9.915


