Copyright
©2012 Baishideng Publishing Group Co.
World J Gastroenterol. Dec 21, 2012; 18(47): 7033-7039
Published online Dec 21, 2012. doi: 10.3748/wjg.v18.i47.7033
Published online Dec 21, 2012. doi: 10.3748/wjg.v18.i47.7033
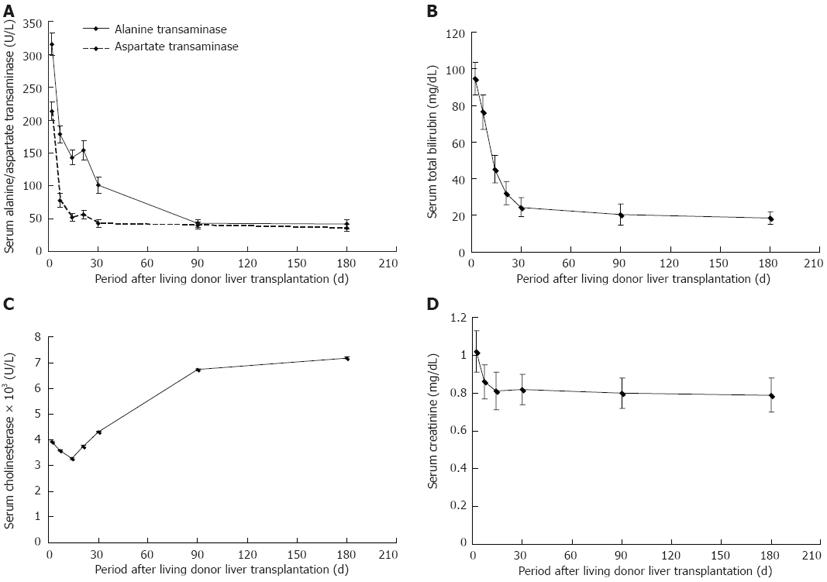
Figure 1 Variation tendency of graft and renal function by post-transplant month 6 in all recipients.
A: Alanine/aspartate transaminase; B: Total bilirubin; C: Cholinesterase; D: Serum creatinine. Data were presented as means ± SD.
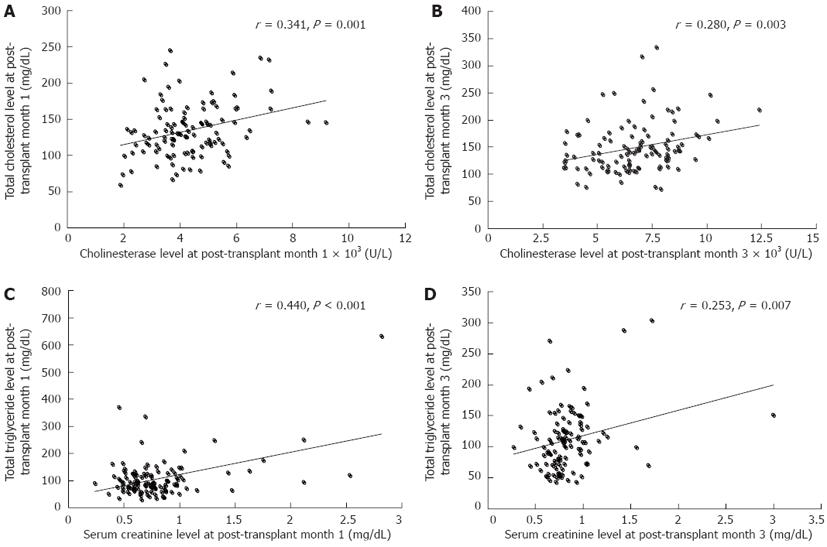
Figure 2 Correlation between serum cholesterol and triglyceride level and cholinesterase at post-transplant.
A: Correlation between serum cholesterol level and cholinesterase at post-transplant month 1; B: Correlation between serum cholesterol level and cholinesterase at post-transplant month 3; C: Correlation between serum triglyceride level and serum creatinine at post-transplant month 1; D: Correlation between serum triglyceride level and serum creatinine at post-transplant month 3.
- Citation: Ling Q, Wang K, Lu D, Guo HJ, Jiang WS, He XX, Xu X, Zheng SS. Major influence of renal function on hyperlipidemia after living donor liver transplantation. World J Gastroenterol 2012; 18(47): 7033-7039
- URL: https://www.wjgnet.com/1007-9327/full/v18/i47/7033.htm
- DOI: https://dx.doi.org/10.3748/wjg.v18.i47.7033


