Copyright
©2012 Baishideng Publishing Group Co.
World J Gastroenterol. Nov 7, 2012; 18(41): 5948-5956
Published online Nov 7, 2012. doi: 10.3748/wjg.v18.i41.5948
Published online Nov 7, 2012. doi: 10.3748/wjg.v18.i41.5948
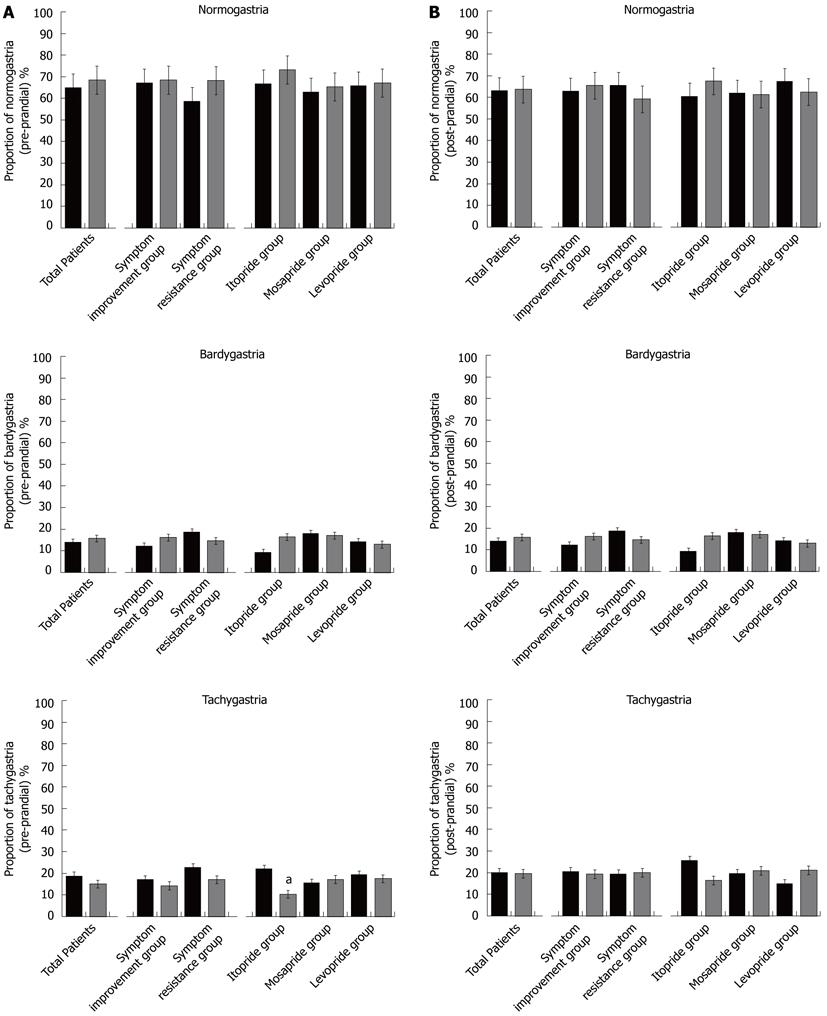
Figure 1 Proportion of gastric slow waves on electrogastrography.
A: Pre-prandial; B: Post-prandial. aP < 0.05 vs pre-treatment.
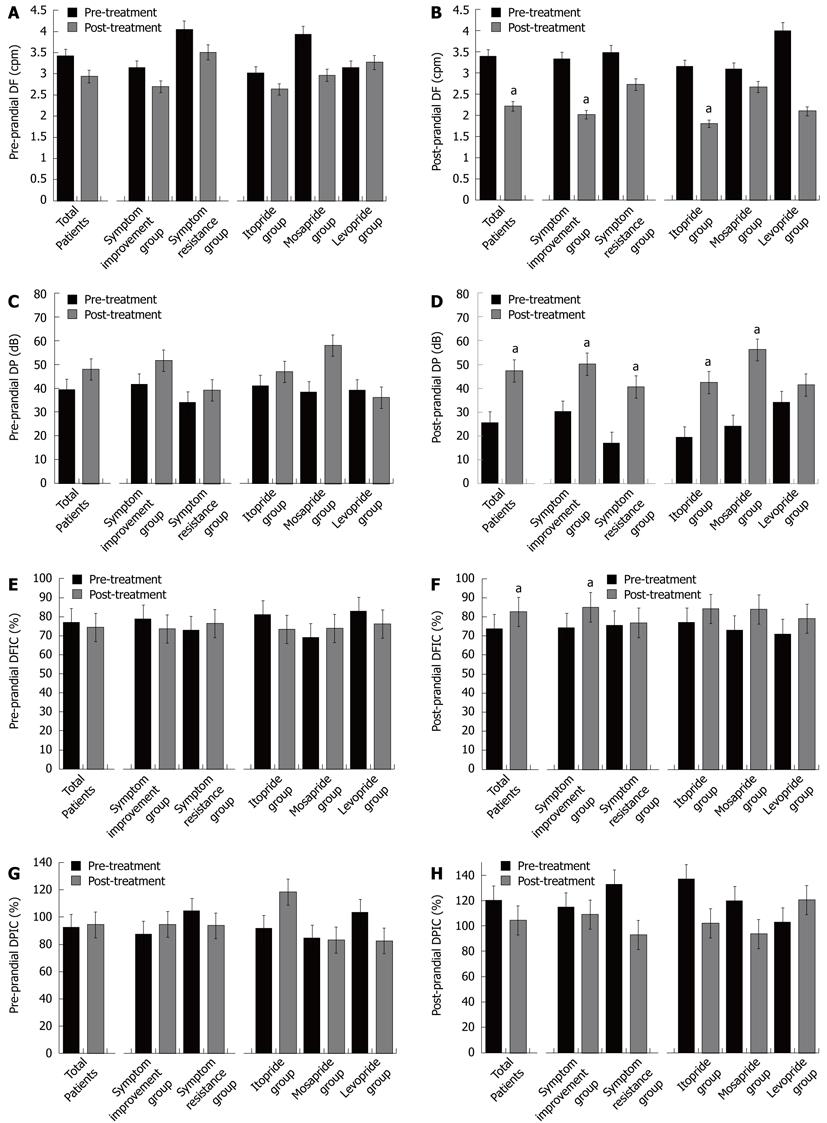
Figure 2 Changes in dominant frequency and dominant power, dominant frequency instability coefficient and dominant power instability coefficient after prokinetic treatment.
A: Dominant frequency (DF) in pre-prandial electrogastrography (EGG); B: DF in post-prandial EGG; C: Dominant power (DP) in pre-prandial EGG; D: DP in post-prandial EGG; E: Dominant frequency instability coefficient (DFIC) in pre-prandial EGG; F: DFIC in post-prandial EGG; G: Dominant power instability coefficient (DPIC) in pre-prandial EGG; H: DPIC in post-prandial EGG. aP < 0.05 vs pre-treatment.
Figure 3 Power ratio before and after the 8-wk course of treatment.
aP < 0.05 vs pre-treatment.
- Citation: Lim HC, Lee SI, Chen JD, Park H. Electrogastrography associated with symptomatic changes after prokinetic drug treatment for functional dyspepsia. World J Gastroenterol 2012; 18(41): 5948-5956
- URL: https://www.wjgnet.com/1007-9327/full/v18/i41/5948.htm
- DOI: https://dx.doi.org/10.3748/wjg.v18.i41.5948


