Copyright
©2012 Baishideng Publishing Group Co.
World J Gastroenterol. Nov 7, 2012; 18(41): 5932-5939
Published online Nov 7, 2012. doi: 10.3748/wjg.v18.i41.5932
Published online Nov 7, 2012. doi: 10.3748/wjg.v18.i41.5932
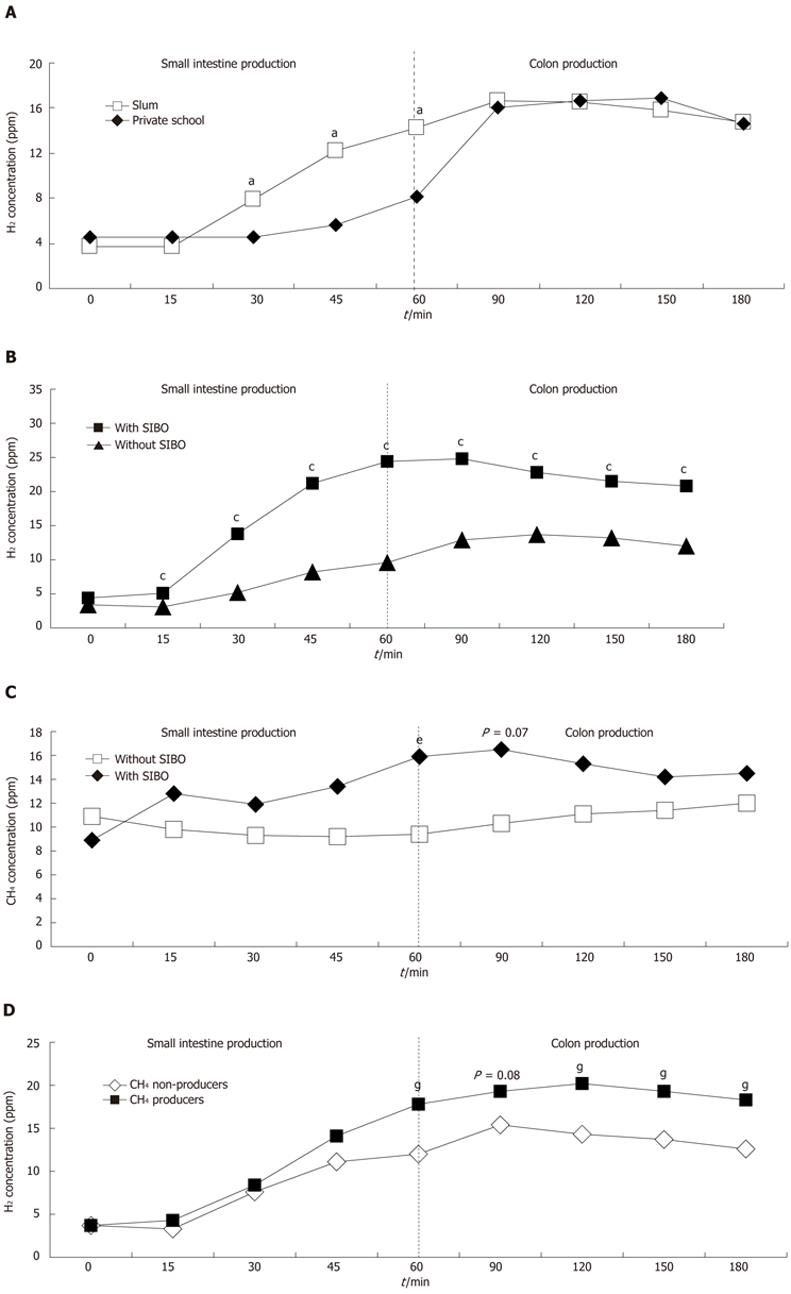
Figure 1 Small intestinal bacterial overgrowth in school-aged children and the relationship between hydrogen and methane production in breath test.
A: Mean concentrations of hydrogen (ppm) in breath samples collected after fasting and at 15, 30, 45, 60, 90, 150 and 180 min after lactulose ingestion from children in the slum (n = 84) and private school (n = 41) groups; B: Mean concentrations of hydrogen (ppm) in breath samples collected after fasting and at 15, 30, 60, 90, 120, 150 and 180 min after lactulose ingestion from children in the slum group with (n = 26) and without (n = 58) small intestinal bacterial overgrowth (SIBO); C: Mean concentrations of methane (ppm) in breath samples collected after fasting and at 15, 30, 60, 90, 120, 150 and 180 min after lactulose ingestion from children in the slum group with (n = 26) and without (n = 58) SIBO; D: Mean concentrations of hydrogen (ppm) in breath samples collected after fasting and at 15, 30, 60, 90, 120, 150 and 180 min after lactulose ingestion from methane-producing (n = 53) and non-producing (n = 31) children in the slum group. Student’s t-test; comparison between groups for collection time during the breath test (complementation of the analysis of area under the curve). aP < 0.05 vs the private school group; cP < 0.05 vs the slum group without SIBO in relation of the hydogen production in breath test; eP < 0.05 vs the slum group without SIBO in relation of the methane production in breath test; gP < 0.05 vs the slum group non-methene producing in relation of the hydrogen production in breath test.
- Citation: Mello CS, Tahan S, Melli LCF, Rodrigues MSDC, Mello RMP, Scaletsky ICA, Morais MB. Methane production and small intestinal bacterial overgrowth in children living in a slum. World J Gastroenterol 2012; 18(41): 5932-5939
- URL: https://www.wjgnet.com/1007-9327/full/v18/i41/5932.htm
- DOI: https://dx.doi.org/10.3748/wjg.v18.i41.5932


