Copyright
©2012 Baishideng Publishing Group Co.
World J Gastroenterol. Jan 28, 2012; 18(4): 356-367
Published online Jan 28, 2012. doi: 10.3748/wjg.v18.i4.356
Published online Jan 28, 2012. doi: 10.3748/wjg.v18.i4.356
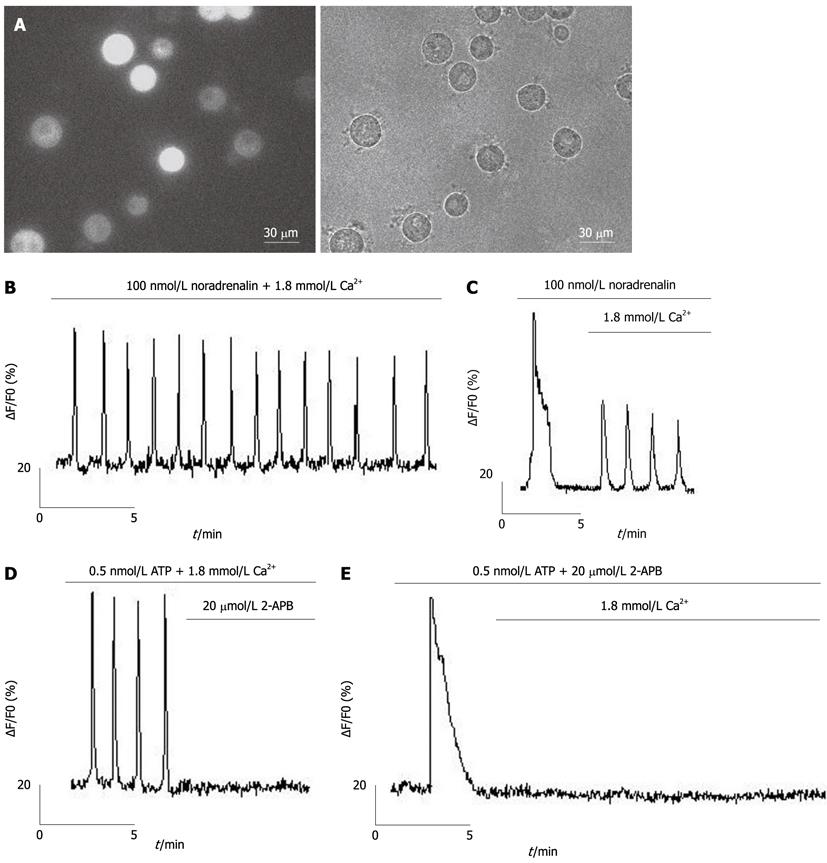
Figure 1 Agonist-induced Ca2+ oscillations are inhibited by blocking Ca2+ entry in freshly isolated rat hepatocytes.
Traces show Ca2+ oscillations in freshly isolated rat hepatocytes, with the abscissa axis as time (min), the vertical axis as Fluo-4 fluorescence intensity (∆F/F0), which demonstrates the changes of [Ca2+]i. The number of hepatocytes measured is indicated by “n”. A: The fluorescence image (left) and microscopic image (right) of freshly isolated hepatocytes loaded with fluo-4/acetoxymethyl. Ca2+ oscillations were initiated by 100 nmol/L noradrenaline in the presence (B, n = 27) or absence (C, n = 16) of extracellular Ca2+. Ca2+ oscillations induced by 0.5 nmol/L adenosine-triphosphate were inhibited by 20 μmol/L 2-APB in the presence (D, n = 14) or absence (E, n = 11) of extracellular Ca2+. 2-APB: 2-aminoethoxydiphenyl borate.
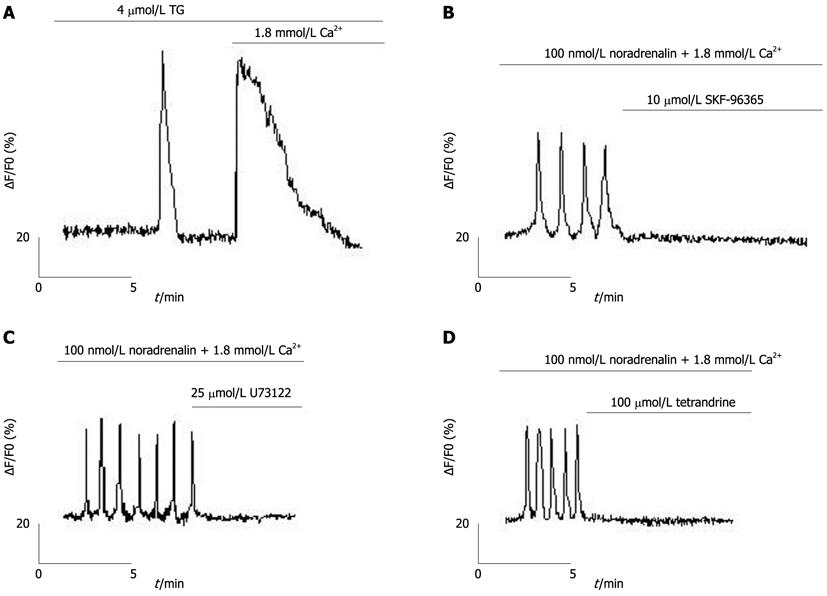
Figure 2 Store-operated calcium channel blockers inhibit Ca2+ oscillations of freshly isolated hepatocytes.
A: Ca2+ stores were depleted with 4 μmol/L thapsigargin (TG), causing two peaks, the first being Ca2+ released from endoplasmic reticulum (ER), and the second peak being Ca2+ entry through the plasma membrane (n = 16); B: 10 μmol/L SKF-96365 inhibited Ca2+ oscillations (n = 12); C: 25 μmol/L U73122 inhibited Ca2+ oscillations (n = 10); D: 100 μmol/L tetrandrine inhibited Ca2+ oscillations (n = 10).
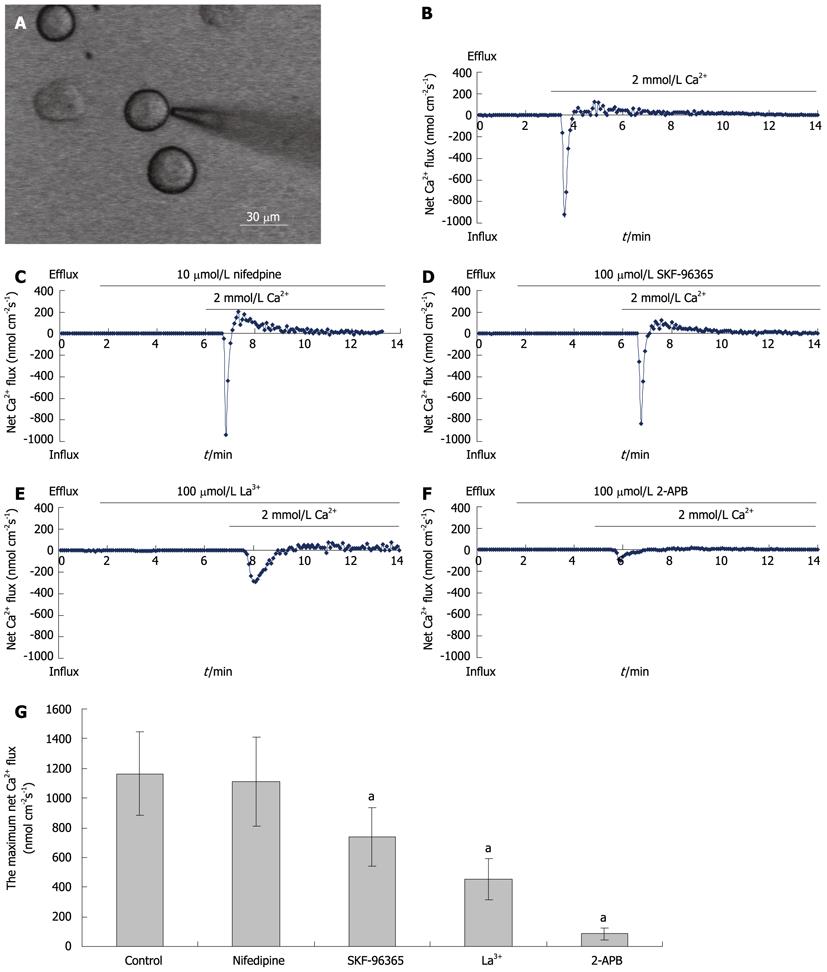
Figure 3 Ca2+ flux in freshly isolated hepatocytes.
A: A screen-printed picture of a cell measured by NMT; B-F: Net Ca2+ fluxes of a freshly isolated rat hepatocyte (B) and repeated in the presence of 10 μmol/L nifedipine (C), 100 μmol/L SKF-96365 (D), 100 μmol/L La3+ (E), and 100 μmol/L 2-APB (F); G: Bar graph of the maximum net Ca2+ fluxes in five groups. aP < 0.01, control group vs SKF-96365, La3+ or 2-APB group. 2-APB: 2-aminoethoxydiphenyl borate.
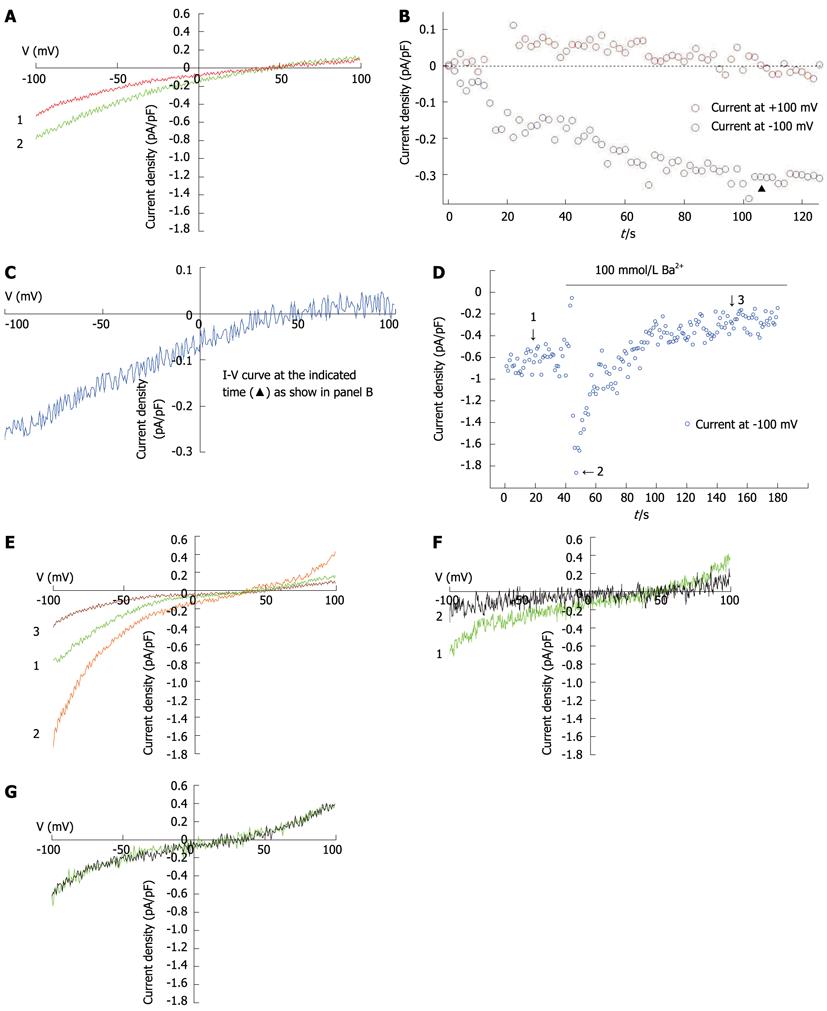
Figure 4 Store-operated calcium currents in freshly isolated hepatocytes.
A: I-V curves of ISOC induced by 10 μmol/L IP3 and 10 mmol/L ethylene glycol tetraacetic acid (EGTA) in hepatocytes, recorded with the voltage ramps from -100 mV to +100 mV, showing the beginning of whole-cell patch-clamp recording (red) and reaching peak current (green) (n = 14); B: Time course of ISOC development, taken at holding potentials of -100 mV and +100 mV for inward and outward currents, respectively; C: I-V curves of ISOC obtained by subtraction of baseline from peak current (the red and green sections of the trace, respectively, as described in A), at the time marked “▲” in B; D: Currents induced by 10 mmol/L EGTA following replacement of Ca2+ with Ba2+ in the external solution (n = 6); E: I-V curves at the three time points indicated by the arrows in panel D: 1, SOC was fully activated by 10 mmol/L EGTA in the pipette solution, 2, 3, The amplitude of ISOC at -100 mV as a function of time when the external solution was replaced by a solution containing 100 mmol/L Ba2+ and no Ca2+ or Mg2+ for the period indicated in D (n = 6); F: Currents stimulated by 10 mmol/L EGTA. The green trace shows the instantaneous current density-voltage relationship in the range of -100 mV to +100 mV obtained in response to a voltage ramp at the time when inward current was fully developed. The black trace was obtained in response to the presence of 100 μmol/L 2-APB (n = 6); G: Effect of 10 μmol/L A9C on current induced by 10 mmol/L EGTA. The green trace shows the instantaneous current density-voltage relationship in the range of -100 mV to 100 mV obtained in response to a voltage ramp at the time when inward current is fully developed. The black trace was obtained in the presence of 10 μmol/L A9C (n = 5).
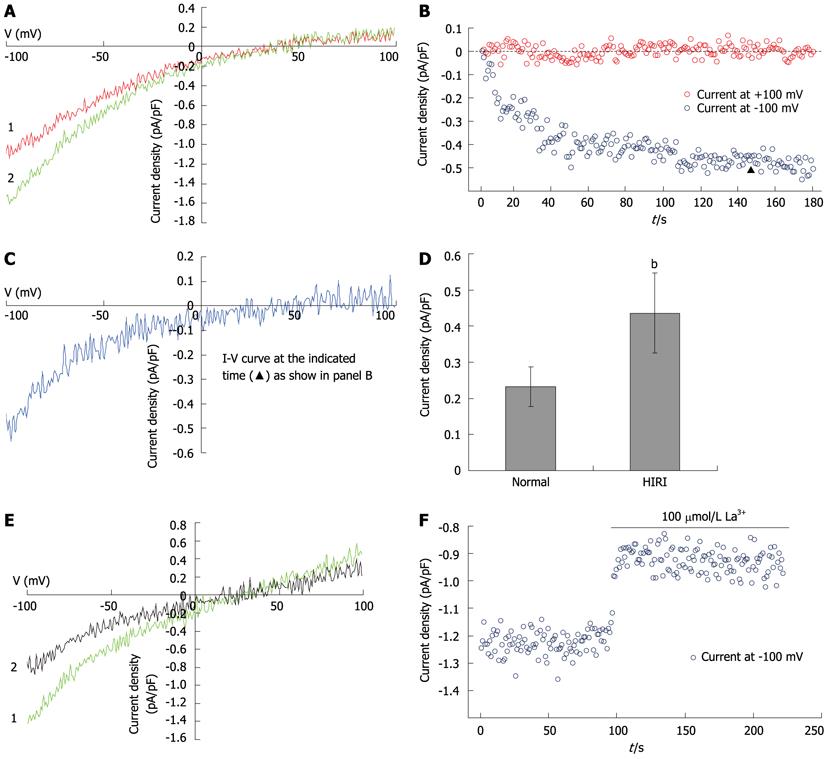
Figure 5 Store-operated calcium channel participates in hepatocellular Ca2+ overload in HIRI.
A: I-V curves of the ISOC induced by 10 mmol/L ethylene glycol tetraacetic acid (EGTA) in HIRI hepatocytes, recorded with voltage ramps from -100 mV to +100 mV. Red trace shows the beginning of whole-cell patch-clamp recording, the green trace shows the peak current (n = 12); B: The time course for development of ISOC in HIRI hepatocytes (n = 12); C: I-V curves of ISOC obtained by subtraction of baseline from peak current (the red and green sections of the trace, respectively, as described in A) at the time marked “▲” in B; D: Bar graph of the mean current density of maximal ISOC recorded at a holding potential of -100 mV in HIRI hepatocytes (n = 12) and controls (n = 24), bP < 0.01; E: ISOC was recorded in HIRI hepatocytes before (green trace) or after (black trace) the application of 100 μmol/L La3+ (n = 7); F: The time course of ISOC development in the presence of 100 μmol/L La3+ in HIRI hepatocytes (n = 7). HIRI: Hepatic ischemia-reperfusion injury.
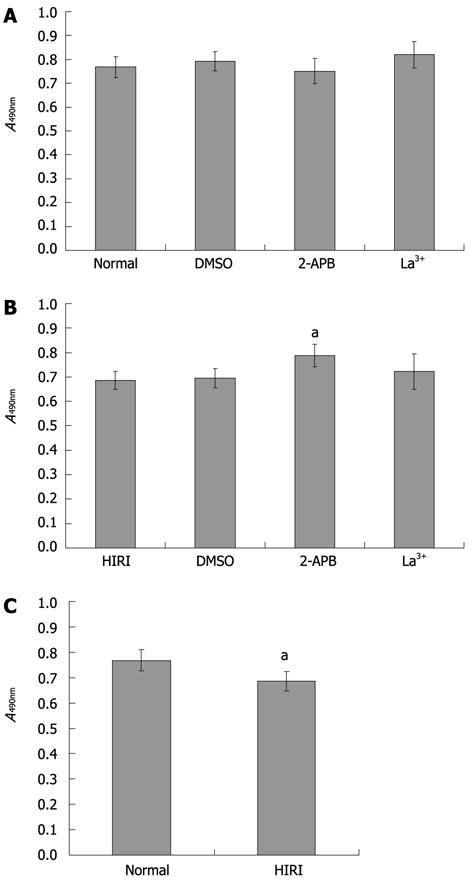
Figure 6 Effects of store-operated calcium channel blockers on cell survival or injuries of normal and hepatic ischemia-reperfusion injuried hepatocytes.
A: MTT assay of normal hepatocytes alone or co-cultivated with 0.025% (v/v) DMSO, 100 μmol/L 2-APB, or 100 μmol/L La3+ (n = 4), the cell survival rate is not significantly different (P > 0.05); B: MTT assay of HIRI hepatocytes alone or cocultivated with 0.025% (v/v) DMSO, 100 μmol/L 2-APB or 100 μmol/L La3+ (n = 4), the average optical absorbance value in hepatocytes pretreated with 100 μmol/L 2-APB (0.79 ± 0.05) was higher than in untreated hepatocytes (0.69 ± 0.04), aP = 0.027; C: Compared with normal hepatocytes, HIRI hepatocytes incurred cell damage (n = 4), aP = 0.029. HIRI: Hepatic ischemia-reperfusion injury; 2-APB: 2-aminoethoxydiphenyl borate; DMSO: Dimethylsulfoxide; MTT: 3-(4,5-dimethylthiazol-2-yl)-2,5-diphenyltetrazolium bromide.
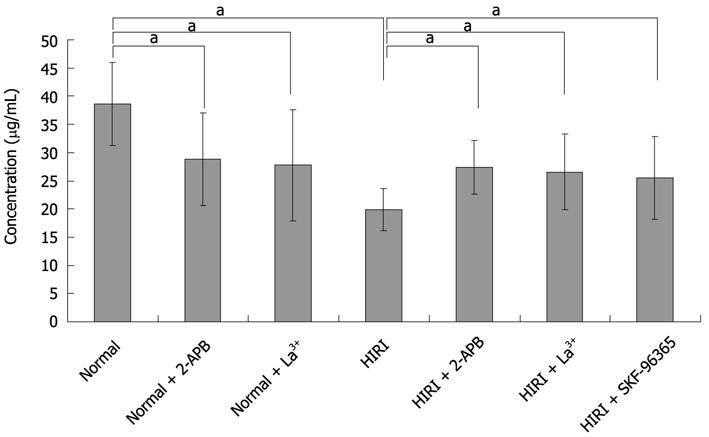
Figure 7 Taurocholate measurements in hepatic ischemia-reperfusion injuried hepatocytes.
Bar graph of taurocholate secreted by hepatocytes is distinctly higher in the supernatant of cultured normal hepatocytes (38.58 ± 7.35 μg/mL, n = 6) than for cells after exposure to 100 μmol/L 2-APB (28.85 ± 8.18 μg/mL, aP < 0.05, n = 6), 100 μmol/L La3+ (27.76 ± 9.86 μg/mL, aP < 0.05, n = 6) or HIRI hepatocytes (19.92 ± 3.75 μg/mL, aP < 0.05, n = 6). Whereas 100 μmol/L 2-APB, 100 μmol/L La3+ and 10 μmol/L SKF-96365 could respectively reverse the taurocholate level to 27.42 ± 4.74, 26.58 ± 6.67 and 25.52 ± 7.30 μg/mL in HIRI hepatocytes, aP < 0.05, n = 6. HIRI: Hepatic ischemia-reperfusion injury; 2-APB: 2-aminoethoxydiphenyl borate.
- Citation: Pan LJ, Zhang ZC, Zhang ZY, Wang WJ, Xu Y, Zhang ZM. Effects and mechanisms of store-operated calcium channel blockade on hepatic ischemia-reperfusion injury in rats. World J Gastroenterol 2012; 18(4): 356-367
- URL: https://www.wjgnet.com/1007-9327/full/v18/i4/356.htm
- DOI: https://dx.doi.org/10.3748/wjg.v18.i4.356


