Copyright
©2012 Baishideng Publishing Group Co.
World J Gastroenterol. Jan 28, 2012; 18(4): 356-367
Published online Jan 28, 2012. doi: 10.3748/wjg.v18.i4.356
Published online Jan 28, 2012. doi: 10.3748/wjg.v18.i4.356
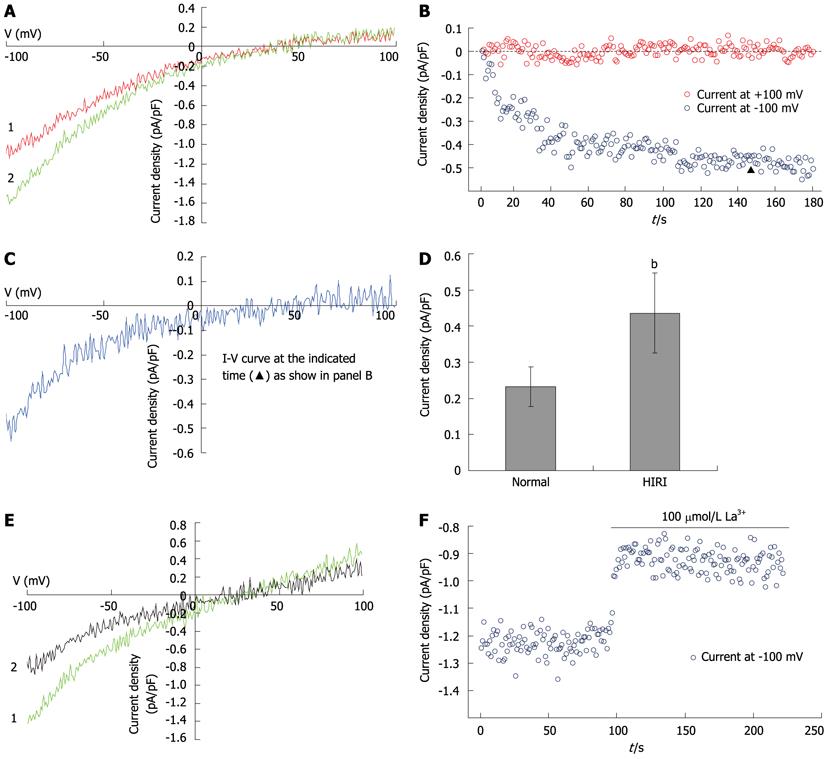
Figure 5 Store-operated calcium channel participates in hepatocellular Ca2+ overload in HIRI.
A: I-V curves of the ISOC induced by 10 mmol/L ethylene glycol tetraacetic acid (EGTA) in HIRI hepatocytes, recorded with voltage ramps from -100 mV to +100 mV. Red trace shows the beginning of whole-cell patch-clamp recording, the green trace shows the peak current (n = 12); B: The time course for development of ISOC in HIRI hepatocytes (n = 12); C: I-V curves of ISOC obtained by subtraction of baseline from peak current (the red and green sections of the trace, respectively, as described in A) at the time marked “▲” in B; D: Bar graph of the mean current density of maximal ISOC recorded at a holding potential of -100 mV in HIRI hepatocytes (n = 12) and controls (n = 24), bP < 0.01; E: ISOC was recorded in HIRI hepatocytes before (green trace) or after (black trace) the application of 100 μmol/L La3+ (n = 7); F: The time course of ISOC development in the presence of 100 μmol/L La3+ in HIRI hepatocytes (n = 7). HIRI: Hepatic ischemia-reperfusion injury.
- Citation: Pan LJ, Zhang ZC, Zhang ZY, Wang WJ, Xu Y, Zhang ZM. Effects and mechanisms of store-operated calcium channel blockade on hepatic ischemia-reperfusion injury in rats. World J Gastroenterol 2012; 18(4): 356-367
- URL: https://www.wjgnet.com/1007-9327/full/v18/i4/356.htm
- DOI: https://dx.doi.org/10.3748/wjg.v18.i4.356


