Copyright
©2012 Baishideng Publishing Group Co.
World J Gastroenterol. Oct 7, 2012; 18(37): 5283-5288
Published online Oct 7, 2012. doi: 10.3748/wjg.v18.i37.5283
Published online Oct 7, 2012. doi: 10.3748/wjg.v18.i37.5283
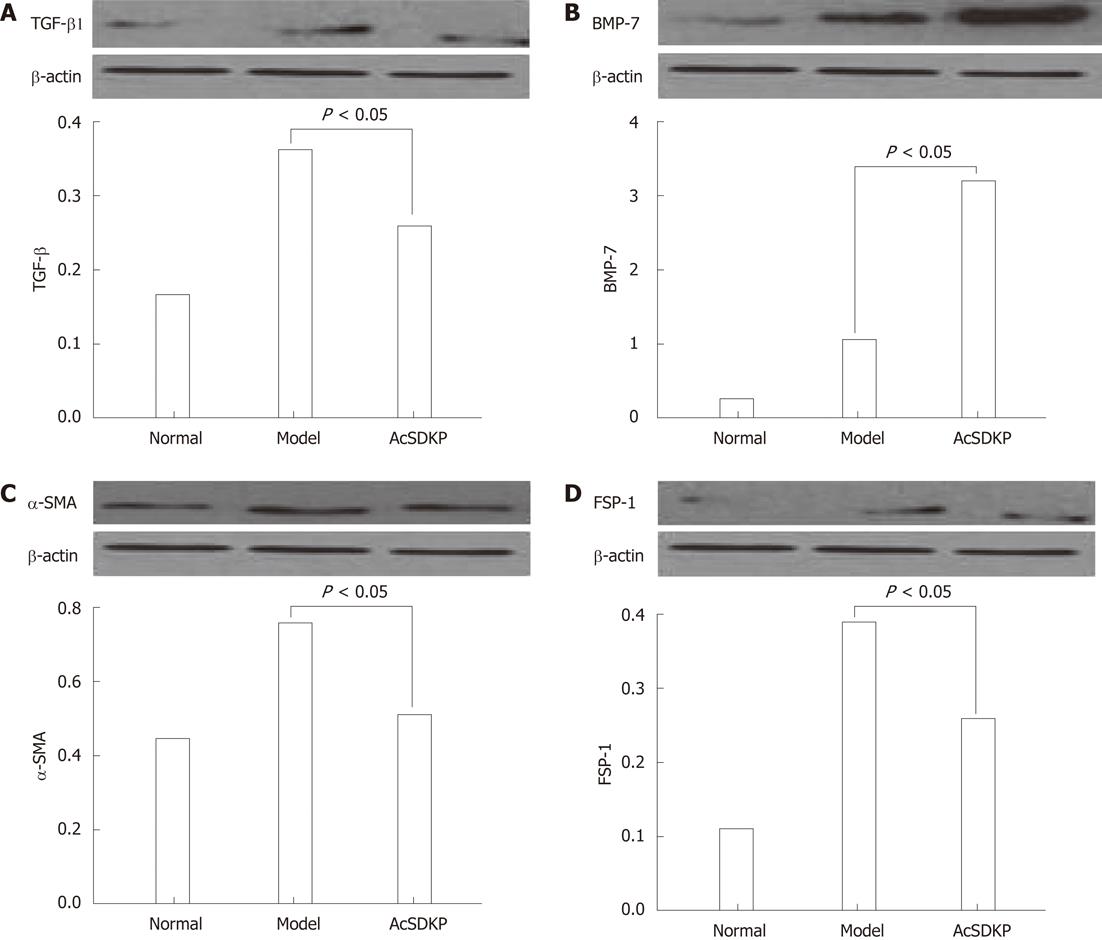
Figure 1 Western blotting and quantitive analysis.
A: Transforming growth factor-β1 (TGF-β1); B: Bone morphogenetic protein-7 (BMP-7); C: α-smooth muscle actin positivity (α-SMA); D: Fibroblast specific protein 1 (FSP-1).
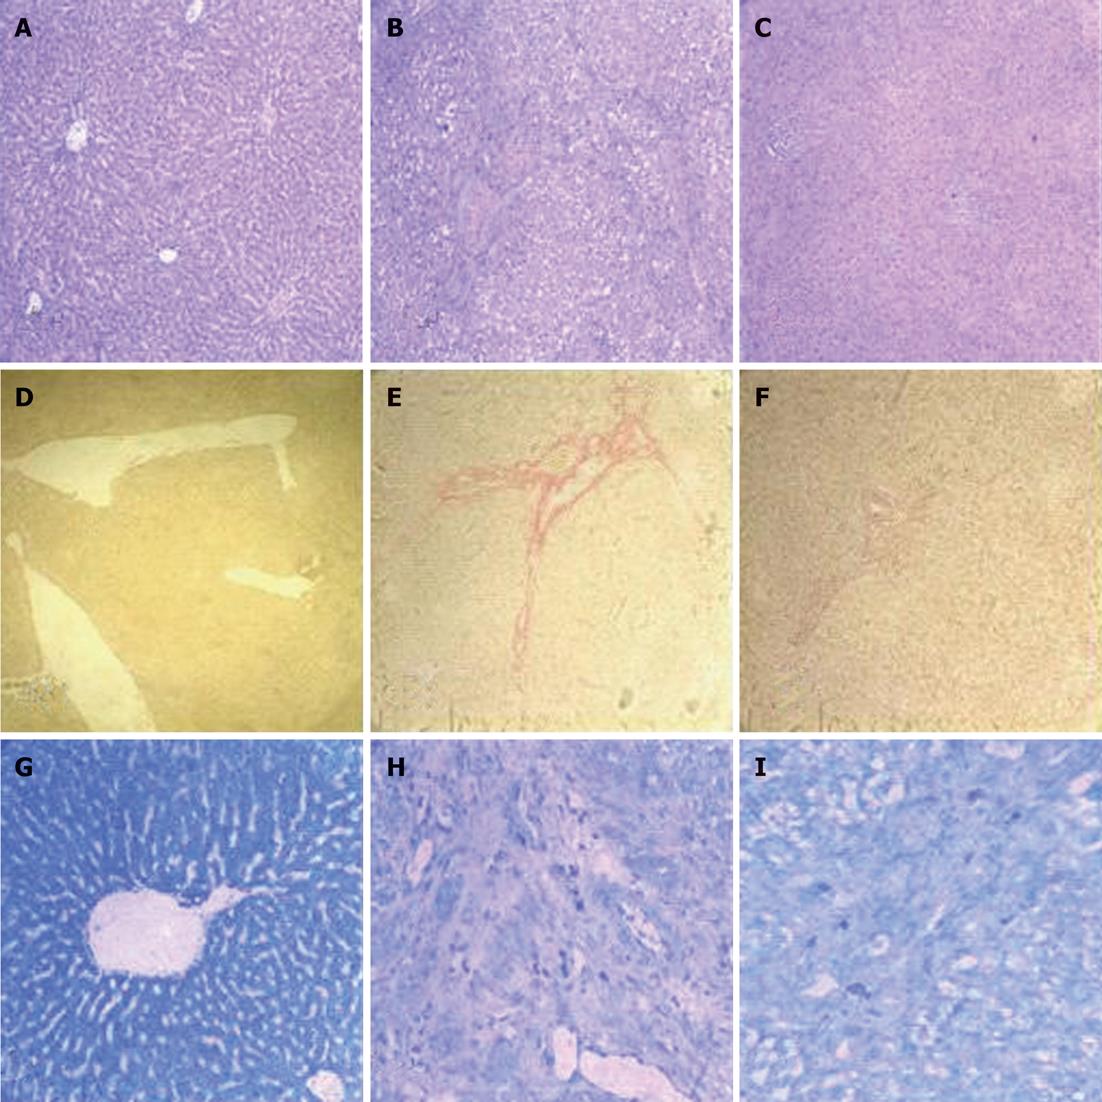
Figure 2 Hematoxylin and eosin, Sirius red, Giemsa staining for liver tissues in each group.
A: Normal, hematoxylin and eosin (HE) (× 100); B: Model, HE (× 100); C: N-acetyl-seryl-aspartyl-lysyl-proline (AcSDKP), HE (× 100); D: Normal, Sirius red (× 100); E: Model, Sirius red (×100); F: AcSDKP, Sirius red (× 100); G: Normal, Giemsa (× 200); H: Model, Giemsa (× 200); I: AcSDKP, Giemsa (× 200).
- Citation: Zhang L, Xu LM, Chen YW, Ni QW, Zhou M, Qu CY, Zhang Y. Antifibrotic effect of N-acetyl-seryl-aspartyl-lysyl-proline on bile duct ligation induced liver fibrosis in rats. World J Gastroenterol 2012; 18(37): 5283-5288
- URL: https://www.wjgnet.com/1007-9327/full/v18/i37/5283.htm
- DOI: https://dx.doi.org/10.3748/wjg.v18.i37.5283


