Copyright
©2012 Baishideng Publishing Group Co.
World J Gastroenterol. Sep 28, 2012; 18(36): 5051-5057
Published online Sep 28, 2012. doi: 10.3748/wjg.v18.i36.5051
Published online Sep 28, 2012. doi: 10.3748/wjg.v18.i36.5051
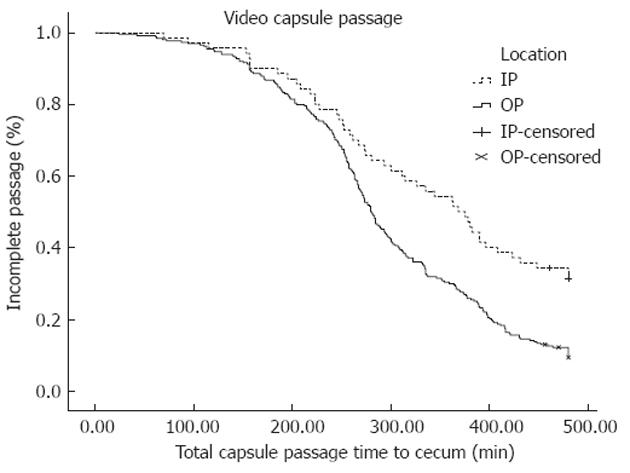
Figure 1 Kaplan-Meier plot of total capsule passage time to cecum.
Incomplete passage percentage and total capsule passage time to cecum were different between inpatients (IP) and outpatients (OP). Data is shown for the IP group (dotted line) vs the OP group (solid line). X-axis represents bowel passage time and Y-axis represents the percentage of patients in whom the capsule has not reached the cecum.
- Citation: Yazici C, Losurdo J, Brown MD, Oosterveen S, Rahimi R, Keshavarzian A, Bozorgnia L, Mutlu E. Inpatient capsule endoscopy leads to frequent incomplete small bowel examinations. World J Gastroenterol 2012; 18(36): 5051-5057
- URL: https://www.wjgnet.com/1007-9327/full/v18/i36/5051.htm
- DOI: https://dx.doi.org/10.3748/wjg.v18.i36.5051


