Copyright
©2012 Baishideng Publishing Group Co.
World J Gastroenterol. Sep 21, 2012; 18(35): 4934-4943
Published online Sep 21, 2012. doi: 10.3748/wjg.v18.i35.4934
Published online Sep 21, 2012. doi: 10.3748/wjg.v18.i35.4934
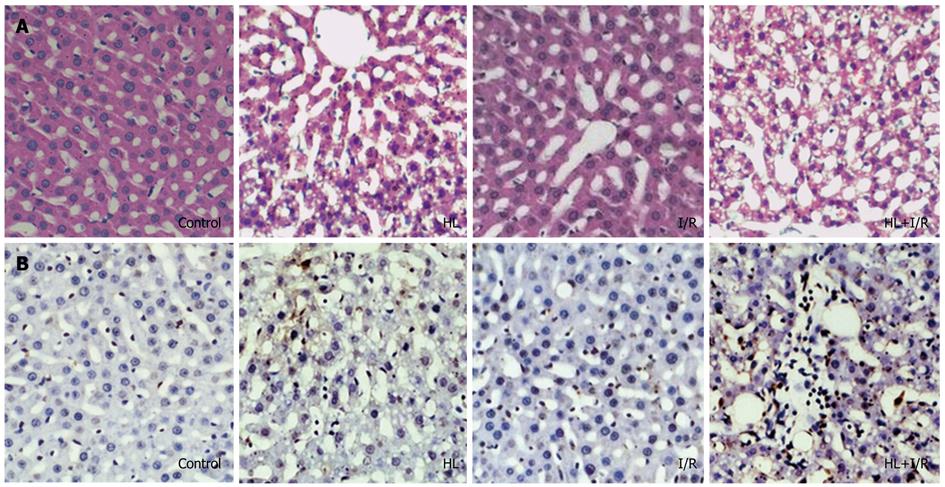
Figure 1 Histology and in situ apoptosis of liver sections from rats after high-fat diet treatment for 18 wk and/or 2 h transient focal cerebral ischemia followed by 24 h reperfusion.
A: HE staining showed liver damage in the hyperlipemia (HL) group and especially in the HL+ ischemia/reperfusion (I/R) group (× 200); B: Transferase dUTP nick-end labeling (TUNEL) staining showed TUNEL-positive apoptotic hepatocytes in the HL+I/R group are significantly greater than those in control, HL or I/R groups (× 200). Slides are representative of 6-10 animals per group.
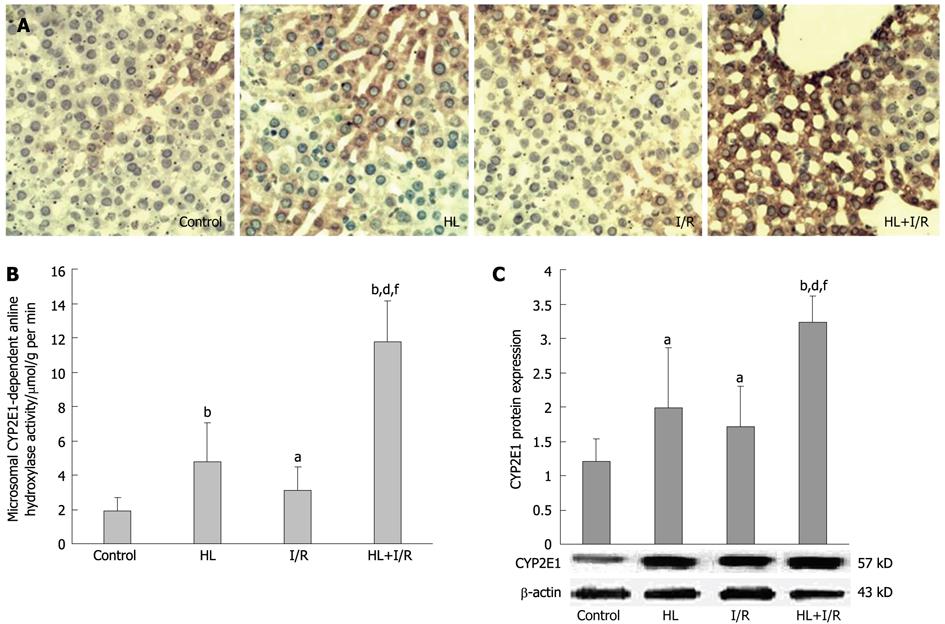
Figure 2 Effect of hyperlipemia plus ischemia/reperfusion on the activity and expression of CYP2E1 in the liver of rats after high-fat diet treatment for 18 wk and/or 2 h transient focal cerebral ischemia followed by 24 h reperfusion.
A: Hepatocytes in the hyperlipemia (HL) + ischemia/reperfusion (I/R) group showed increased cytochrome P450 2E1 (CYP2E1) expression examined by immunohistochemical staining (× 200) than those in other groups. Slides are representative of 6-10 animals per group; B: Microsomal hydroxylase activity of the CYP2E1-containing enzyme measured with aniline as the substrate was much higher in the HL+I/R group; C: HL+I/R enhanced the expression level of CYP2E1 protein in liver microsomes, which was confirmed by Western blotting. Values are the mean ± SD. aP < 0.05, bP < 0.01 vs control group; dP < 0.01 vs HL group; fP < 0.01 vs I/R group.
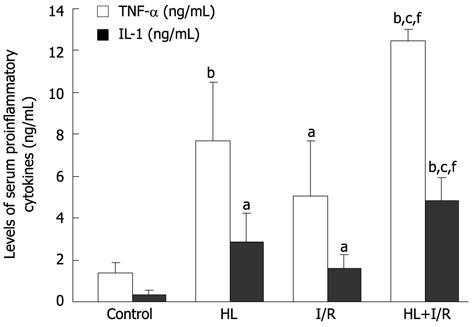
Figure 3 Effect of hyperlipemia + ischemia/reperfusion on the level of serum pro-inflammatory cytokines after high-fat diet treatment for 18 wk and/or 2 h transient focal cerebral ischemia followed by 24 h reperfusion.
Serum pro-inflammatory cytokines in the hyperlipemia (HL) + ischemia/reperfusion (I/R) group were significantly higher compared to those in other groups. A: Tumor necrosis factor (TNF)-α; B: Interleukin (IL)-1. Values are the mean ± SD. aP < 0.05, bP < 0.01 vs control group; cP < 0.05 vs HL group; fP < 0.01 vs I/R group.
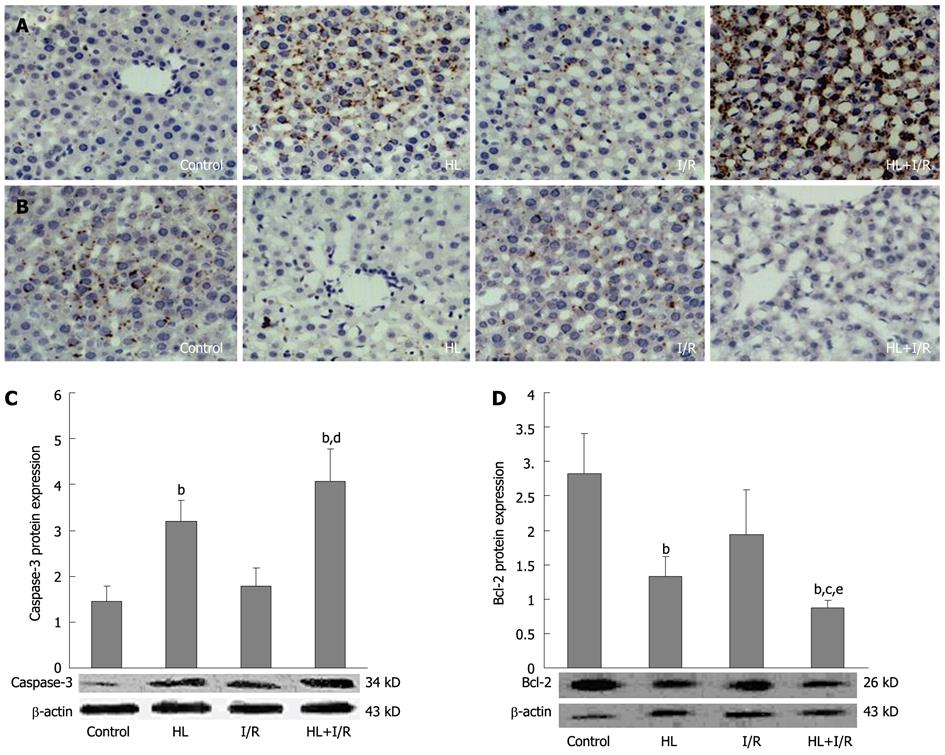
Figure 4 Expressions of bcl-2 and caspase-3 protein in liver after high-fat diet treatment for 18 wk and/or 2 h transient focal cerebral ischemia followed by 24 h reperfusion.
Liver sections from different groups were immunohistochemically stained to assay the expression of caspase-3 and bcl-2 (× 200). A: Protein expression of caspase-3 was markedly elevated in the hyperlipemia (HL) + ischemia/reperfusion (I/R) group; B: Protein expression of bcl-2 was dramatically decreased in the HL+I/R group. C, D: Slides are representative of 6-10 animals per group. Liver homogenates were prepared, and then the expression levels of caspase-3 (C) and bcl-2 (D) proteins in liver were confirmed by Western blotting. Values are the mean ± SD. bP < 0.01 vs control group; cP < 0.05, dP < 0.01 vs HL group; eP < 0.05 vs I/R group.
- Citation: Gong WH, Zheng WX, Wang J, Chen SH, Pang B, Hu XM, Cao XL. Coexistence of hyperlipidemia and acute cerebral ischemia/reperfusion induces severe liver damage in a rat model. World J Gastroenterol 2012; 18(35): 4934-4943
- URL: https://www.wjgnet.com/1007-9327/full/v18/i35/4934.htm
- DOI: https://dx.doi.org/10.3748/wjg.v18.i35.4934


