Copyright
©2012 Baishideng Publishing Group Co.
World J Gastroenterol. Sep 21, 2012; 18(35): 4875-4884
Published online Sep 21, 2012. doi: 10.3748/wjg.v18.i35.4875
Published online Sep 21, 2012. doi: 10.3748/wjg.v18.i35.4875
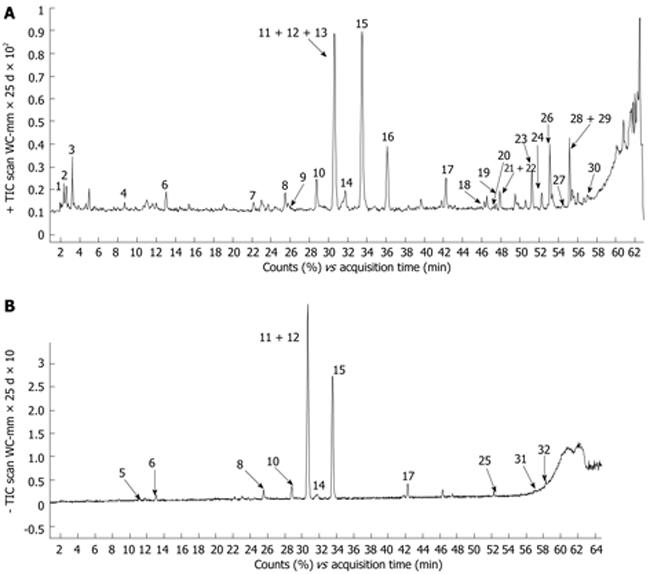
Figure 1 High pressure liquid chromatograph/mass spectrometry analysis of Tangweian Jianji extract.
A: Representative total ion current (TIC) chromatograms of the Tangweian Jianji (TWAJJ) extract were obtained in positive ion electrospray; B: TIC chromatograms of the TWAJJ extract was obtained in negative ion electrospray. Visual inspection of the two TIC plots shows that the two modes of ionization generate different constituent information based on the ionizability differences of the components in TWAJJ. A total of 32 peaks were observed. The most abundant compounds identified are Naringin (peak 12), Neohesperidin (peak 15), Lobetyolin (peak 16), Atractylenolide (peak 26) and Emodin (peak 23). WC: Wave chromatogram.
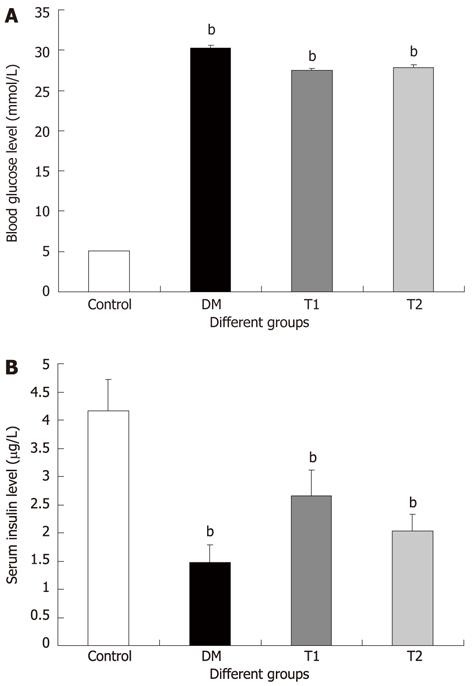
Figure 2 Blood glucose levels and serum insulin levels in the different groups.
A: Blood glucose levels; B: Serum insulin level. DM, T1 and T2 groups compared with the control group. bP < 0.01 vs control group. DM: Diabetic control; T1: High dose; T2: Low dose.
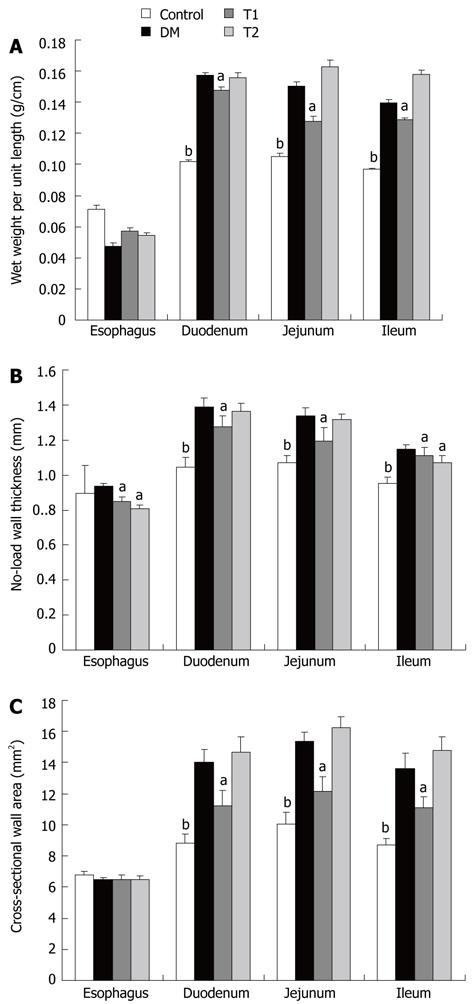
Figure 3 Wet weight per unit length, wall thickness and wall area in different segments of the different groups.
A: Wet weight per unit length; B: Wall thickness; C: Wall area. aP < 0.05, bP < 0.01 vs DM group. DM: Diabetic control; T1: High dose; T2: Low dose.
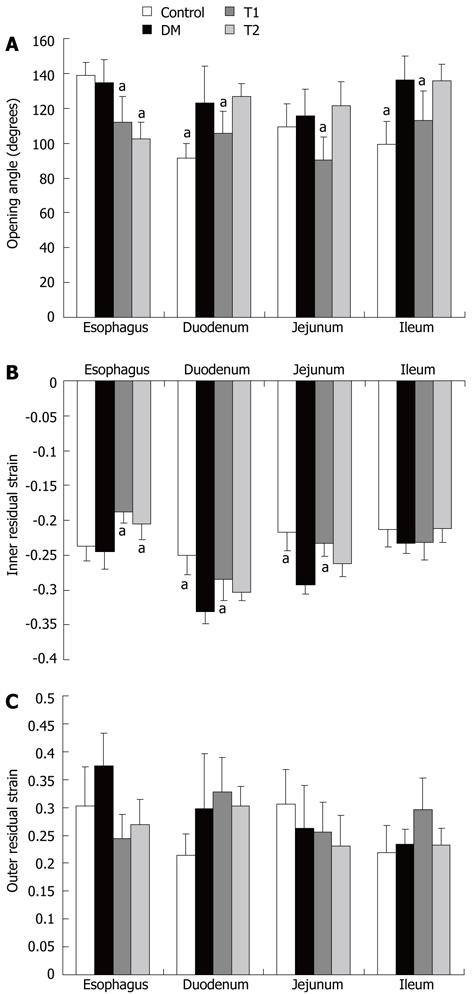
Figure 4 Opening angle, inner residual strain and outer residual strain in different segments of the groups.
A: Opening angle; B: Inner residual strain; C: Outer residual strain. aP < 0.05 vs DM group. DM: Diabetic control; T1: High dose; T2: Low dose.
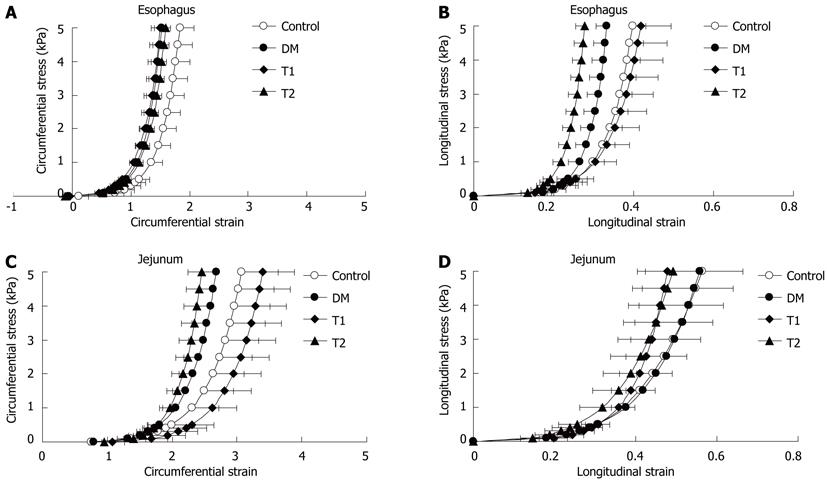
Figure 5 Circumferential and longitudinal stress-strain curves of esophageal and jejunal segments in the different groups.
DM: Diabetic control; T1: High dose; T2: Low dose.
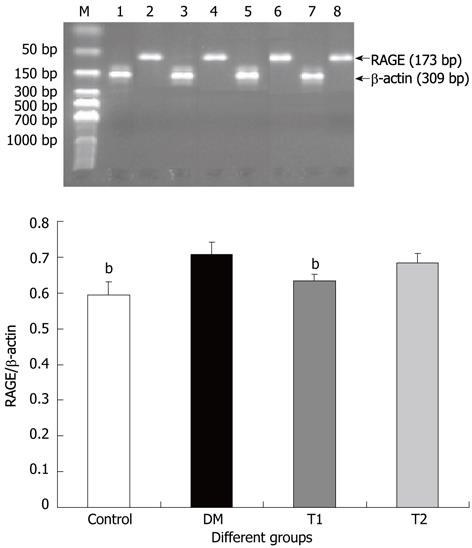
Figure 6 Receptor of advanced glycation end-products mRNA level of the jejunal segment in the different groups.
bP < 0.01 vs DM group. M: Ladder marker; 1, 3, 5, 7: β-actin; 2, 4, 6, 8: RAGE; 1, 2: Control; 3, 4: DM; 5, 6: T1; 7, 8: T2. DM: Diabetic control; T1: High dose; T2: Low dose; RAGE: Receptor of advanced glycation end-products.
- Citation: Liu GF, Zhao JB, Zhen Z, Sha H, Chen PM, Li M, Zhang JC, Yuan MZ, Gao W, Gregersen H, Tong XL. Effect of Tangweian Jianji on upper gastrointestinal remodeling in streptozotocin-induced diabetic rats. World J Gastroenterol 2012; 18(35): 4875-4884
- URL: https://www.wjgnet.com/1007-9327/full/v18/i35/4875.htm
- DOI: https://dx.doi.org/10.3748/wjg.v18.i35.4875


