Copyright
©2012 Baishideng Publishing Group Co.
World J Gastroenterol. Aug 21, 2012; 18(31): 4102-4117
Published online Aug 21, 2012. doi: 10.3748/wjg.v18.i31.4102
Published online Aug 21, 2012. doi: 10.3748/wjg.v18.i31.4102
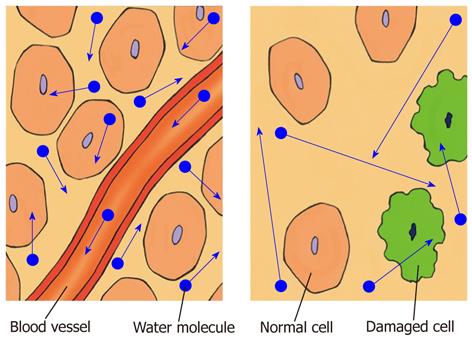
Figure 1 Diffusion of water molecules.
Highly cellular tissues with intact cell membrane restrict the movement of water molecules within intravascular, intracellular, and extracellular space. In contrast, relatively less cellular tissues or damaged cells with defective cellular membrane increase extracellular space, which allow greater water molecule movement.
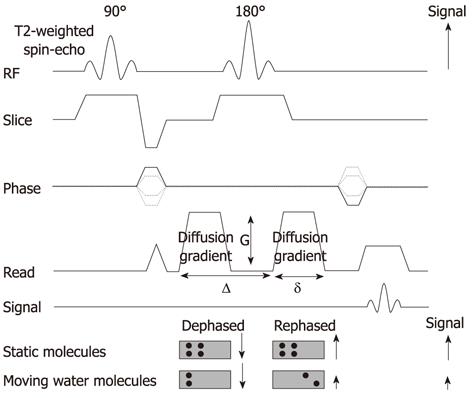
Figure 2 Diagram of diffusion-weighted sequence.
DWI is based on T2-weighted spin-echo sequencing with application of two equal gradient pulses (a dephasing gradient and a rephasing gradient) on each side of the 180° radiofrequency pulse. Static molecules are dephased by the first diffusion gradient and rephased perfectly by the second diffusion gradient; therefore measured high signal intensity is preserved. In contrast, moving molecules undergo dephasing but are not entirely rephased by the second gradient because of their motion, thereby resulting in signal loss. DWI: Diffusion-weighted magnetic resonance imaging; RF: Radiofrequency.
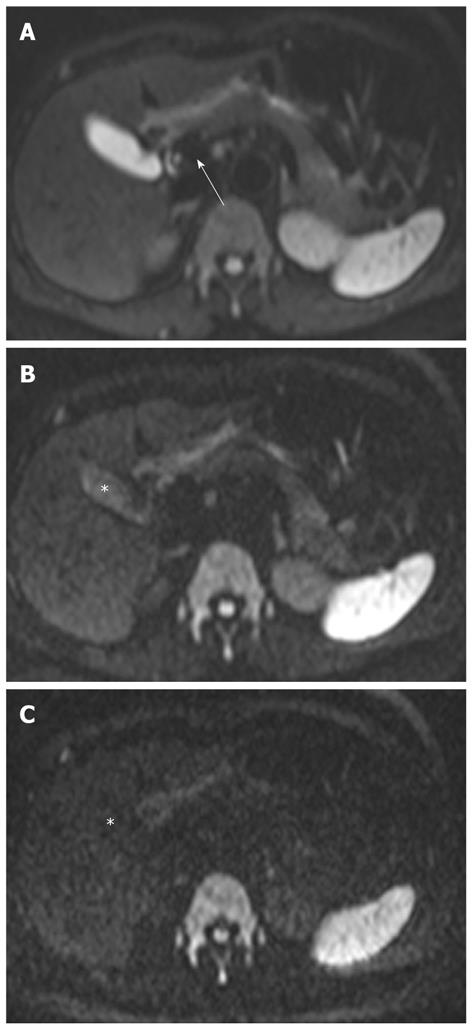
Figure 3 DWI of the normal liver, pancreas, and biliary tract.
A: DWI at b = 50 s/mm2 shows that the liver is hypointense compared to the kidney and spleen, and isointense compared to the pancreas; there is a signal void within the portal vein (arrow). DWI using low b values results in decreasing signals of fast motion of water molecules, such as that occurring within vessels. Such images are referred to as black-blood images; B: DWI at b = 500 s/mm2 shows that the signal intensity of bile is decreased (asterisk) and the wall of the gallbladder is not identified. The liver is isointense compared to the pancreas; C: DWI at b = 1000 s/mm2 shows a significant reduction in the signal intensity of bile in the gallbladder (asterisk). DWI: Diffusion-weighted magnetic resonance imaging.
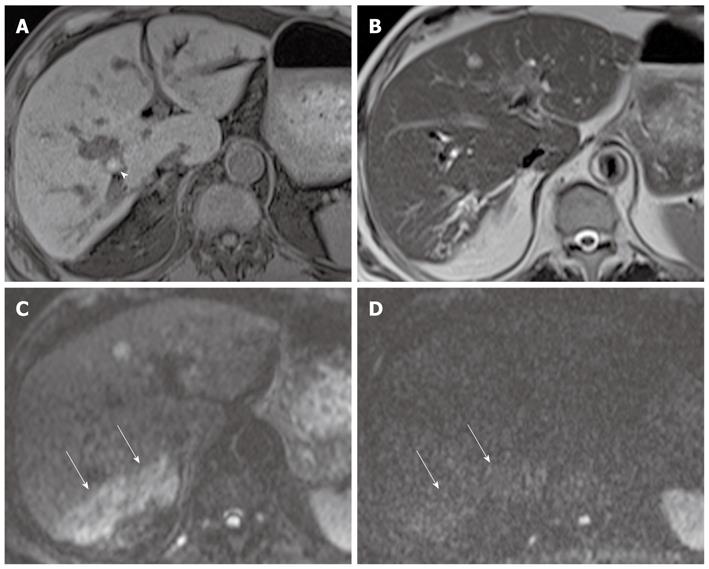
Figure 4 Parenchymal changes in acute cholangitis in a 76-year-old man.
A: Axial fat-saturated T1-weighted image shows a hyperintense stone (arrowhead) with upstream bile duct dilation; B: Axial T2-weighted rapid acquisition relaxation enhancement image shows mild bile duct dilatation in the right lobe of the liver, but no definite area of increased parenchymal signal intensity; C: DWI at b = 50 s/mm2 shows wedge-shaped areas of increased parenchymal signal intensity in segment 6 (arrows). Parenchymal changes are more conspicuous on black-blood images than on routine T2-weighted images; D: DWI at b = 800 s/mm2 shows that most areas of increased parenchymal signal intensity usually return to isointensity (arrows). Such a finding can be a clue for differentiating parenchymal changes due to cholangitis from abscesses. DWI: Diffusion-weighted magnetic resonance imaging.
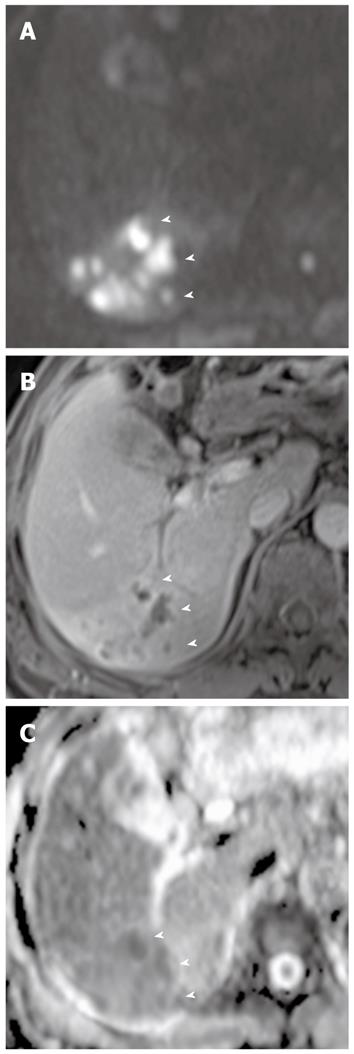
Figure 5 Liver abscesses complicating acute cholangitis in a 79-year-old man.
A: DWI at b = 1000 s/mm2 shows multiple liver abscesses with high signal intensity (arrowheads); B: Multiple abscesses with peripheral rim enhancement (arrowheads) are less conspicuous on contrast-enhanced fat-saturated T1-weighted images (B) than on DWI (A); C: On an ADC map, multiple abscesses appear as low signal intensity (arrowheads) due to restriction of diffusion. DWI: Diffusion-weighted magnetic resonance imaging; ADC: Apparent diffusion coefficient.
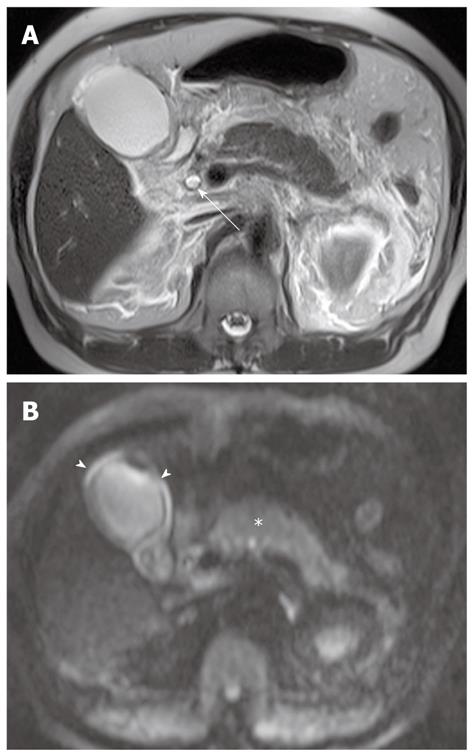
Figure 6 Acute pancreatitis and cholecystitis due to a bile duct stone in a 72-year-old woman.
A: Axial T2-weighted rapid acquisition relaxation enhancement image demonstrates stones in the distal common bile duct (arrow), a distended gallbladder with pericholecystic fluid, and pancreatic edema with peripancreatic fluid, findings suggestive of cholecystitis and pancreatitis; B: DWI at b = 800 s/mm2 shows that the pancreas is slightly hyperintense (asterisk) compared to the liver, and the presence of a peripancreatic fluid collection; findings indicative of pancreatitis. A distended gallbladder with diffuse and symmetric high signal intensity in the wall (arrowheads), due to the restriction of water diffusion in the inflamed gallbladder wall, is also seen. DWI: Diffusion-weighted magnetic resonance imaging.
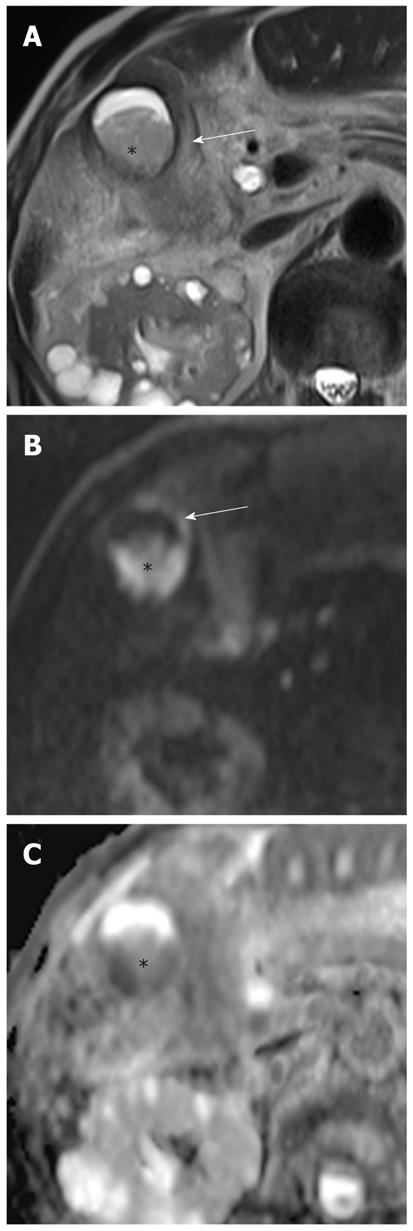
Figure 7 Gallbladder empyema in a 92-year-old man.
A: Axial T2-weighted rapid acquisition relaxation enhancement image demonstrates a fluid-fluid level with low signal intensity in the dependent portion (asterisk) of an inflamed gallbladder (arrow); B: DWI at b = 1000 s/mm2 shows purulent bile with high signal intensity (asterisk), and diffuse, symmetric high signal intensity in the wall of the gallbladder (arrow); C: On an ADC map, pus in the dependent portion of the gallbladder appears with low signal intensity (asterisk) due to restriction of diffusion. Empyema was confirmed by aspiration of pus during percutaneous cholecystostomy. DWI: Diffusion-weighted magnetic resonance imaging; ADC: Apparent diffusion coefficient.
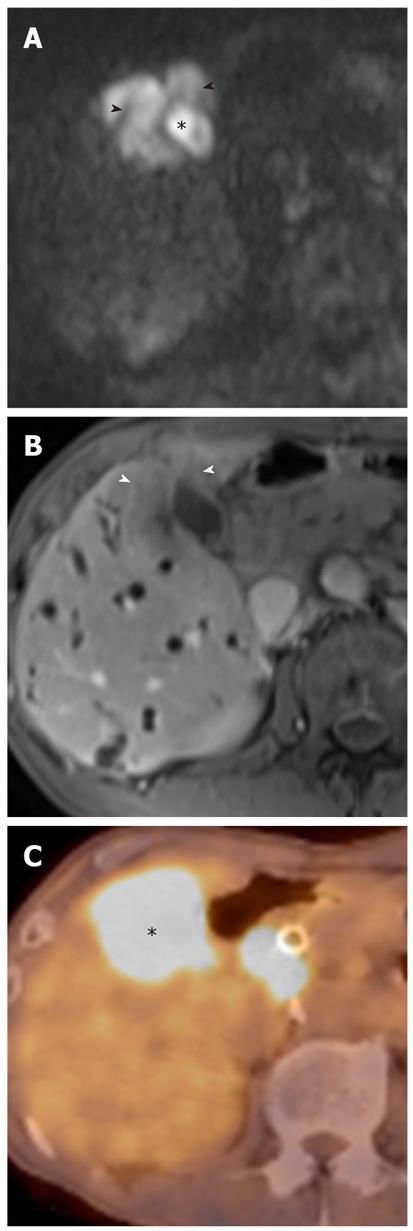
Figure 8 Gallbladder carcinoma in a 70-year-old man.
A: DWI at b = 1000 s/mm2 shows high signal intensity in the mass occupying the entire gallbladder (asterisk), which invades the hepatic parenchyma adjacent to the gallbladder (arrowheads); B: Gallbladder carcinoma with direct liver invasion (arrowheads) is less conspicuous on contrast-enhanced, fat-saturated T1-weighted images than on DWI; C: Fused positron emission tomography-CT image confirms intense hypermetabolism (asterisk) in the gallbladder carcinoma with direct liver invasion adjacent to the gallbladder. DWI: Diffusion-weighted magnetic resonance imaging; CT: Computed tomography.
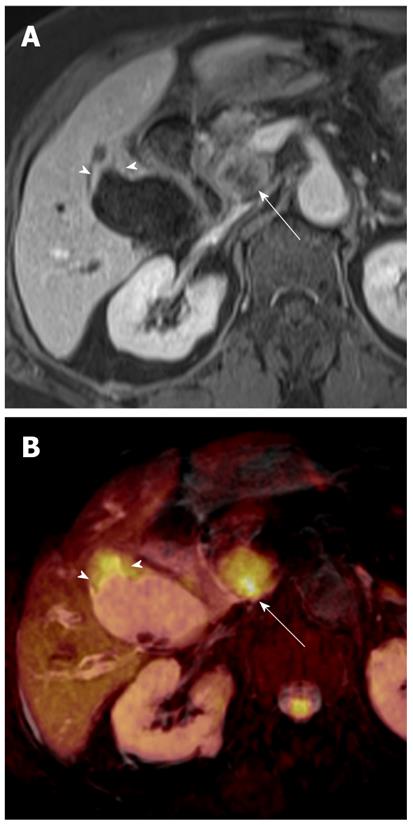
Figure 9 Gallbladder carcinoma (focal wall-thickening type) in a 77-year-old woman.
A: Axial contrast-enhanced, fat-saturated, T1-weighted image shows focal wall thickening (arrowheads) in the gallbladder with a metastatic lymph node in the portocaval space (arrow); B: Fusion image of T2-weighted image and DWI at b = 800 s/mm2 shows focal, asymmetric high signal intensity in the fundal portion of the gallbladder (arrowheads) with a hyperintense metastatic lymph node in the portocaval space (arrow). DWI: Diffusion-weighted magnetic resonance imaging.
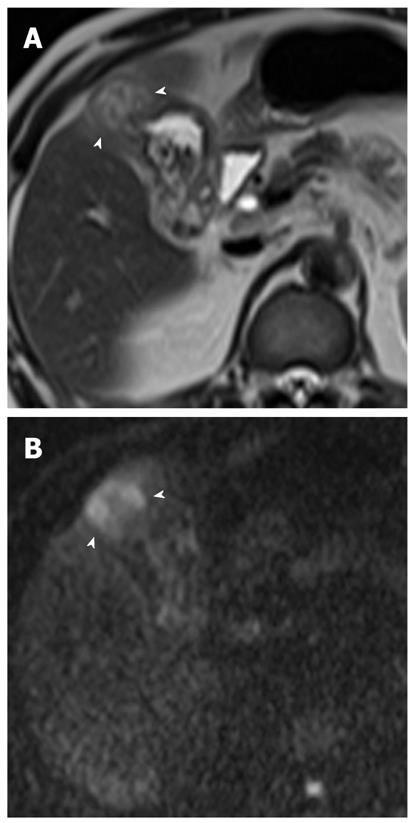
Figure 10 Xanthogranulomatous cholecystitis in a 55-year-old man.
A: Axial T2-weighted rapid acquisition relaxation enhancement image shows focal wall thickening with a fundal mass (arrowheads). There is focal high signal intensity within the thickened wall of the gallbladder; a finding that is consistent with an intramural collection; B: DWI at b = 800 s/mm2 shows focal high signal intensity in the fundal portion of the gallbladder (arrowheads). Xanthogranulomatous cholecystitis was confirmed by laparoscopic cholecystectomy. DWI: Diffusion-weighted magnetic resonance imaging.
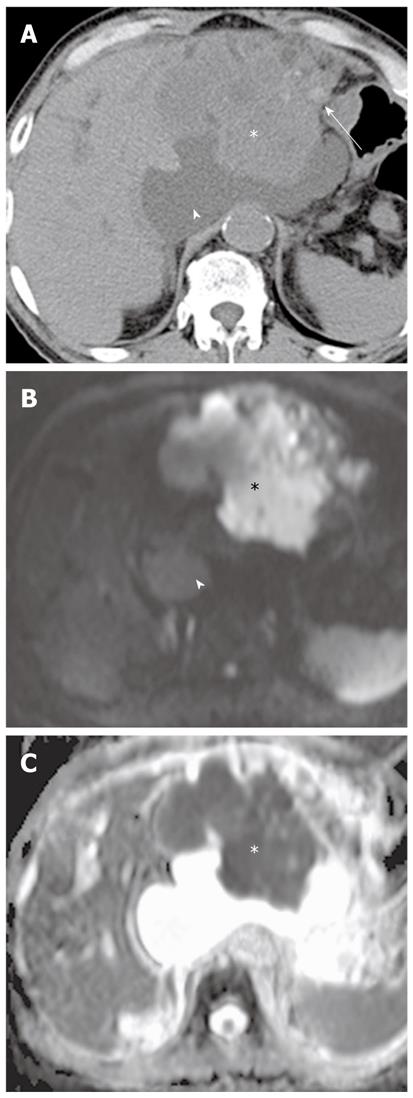
Figure 11 Intrahepatic cholangiocarcinoma (mass-forming type) in a 71-year-old man.
A: Nonenhanced CT image shows intrahepatic cholangiocarcinoma in the left lobe of the liver (asterisk), stones in the dilated left bile ducts (arrow), and a fluid collection in the lesser sac (arrowhead); B: DWI at b = 1000 s/mm2 shows intrahepatic cholangiocarcinoma with high signal intensity (asterisk). Note a fluid collection (arrowhead) in the lesser sac, which appears as significant attenuation of the signal intensity reduction at a high b value; C: On the ADC map, cholangiocarcinoma appears as low signal intensity (asterisk) due to restriction of diffusion. DWI: Diffusion-weighted magnetic resonance imaging; CT: Computed tomography; ADC: Apparent diffusion coefficient.
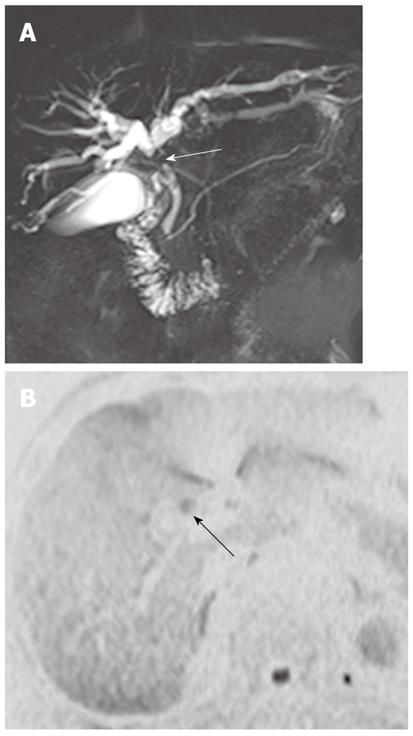
Figure 12 Cholangiocarcinoma (periductal-infiltrating type) in a 70-year-old man.
A: Coronal image from thick-slab, single-shot MRCP shows marked dilatation of the intrahepatic ducts and abrupt narrowing at the confluence of the hepatic duct (arrow); B: DWI at b = 800 s/mm2 with inverted black-and-white image contrast clearly depicts the mass (arrow) at the confluence of the hepatic duct. DWI: Diffusion-weighted magnetic resonance imaging; MRCP: Magnetic resonance cholangiopancreatography.
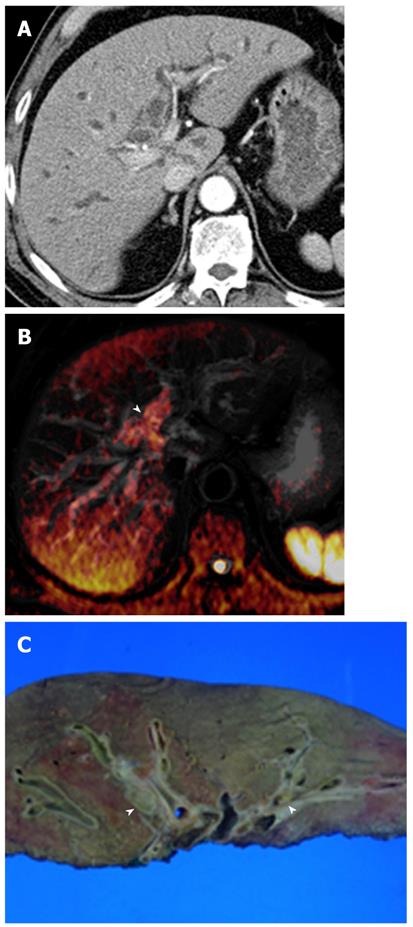
Figure 13 Hilar cholangiocarcinoma (intraductal-growing type) in a 67-year-old man.
A: Contrast-enhanced CT shows mild intrahepatic duct dilatation. However, intraductal masses are not clearly depicted on CT; B: Fusion image of T2-weighted and diffusion-weighted images at b = 800 s/mm2 shows high signal intensity (arrowhead) at the first branch of the intrahepatic duct; C: Photograph of the gross specimen shows intraductal growing masses (arrowheads) in the bile duct. Histological analysis revealed biliary intraepithelial neoplasia with high grade dysplasia. CT: Computed tomography.
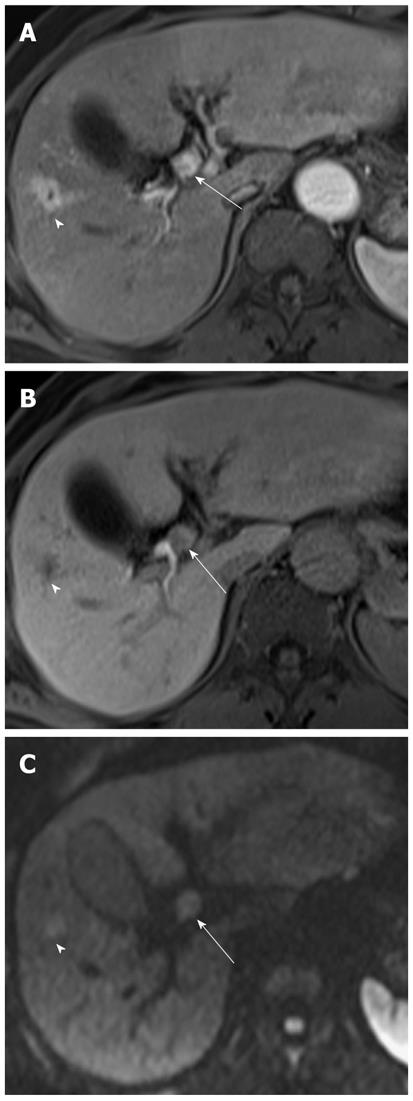
Figure 14 Hepatocellular carcinoma with tumor thrombus in bile duct in a 62-year-old man.
A: Gadoxetic acid-enhanced T1-weighted image obtained during the arterial phase shows a hypervascular HCC in the right lobe of the liver (arrowhead) and an intraluminal enhancing mass (arrow) in the common hepatic duct; B: On gadoxetic-acid-enhanced T1-weighted image obtained 20 min after injection, a small HCC (arrowhead) is hypointense relative to the surrounding liver. Contrast material filling the left intrahepatic duct is delayed owing to a partial bile duct obstruction caused by tumor thrombus in the bile duct (arrow); C: DWI at b = 800 s/mm2 shows a hyperintense small HCC (arrowhead) and tumor thrombus in the bile duct (arrow). HCC: Hepatocellular carcinoma.
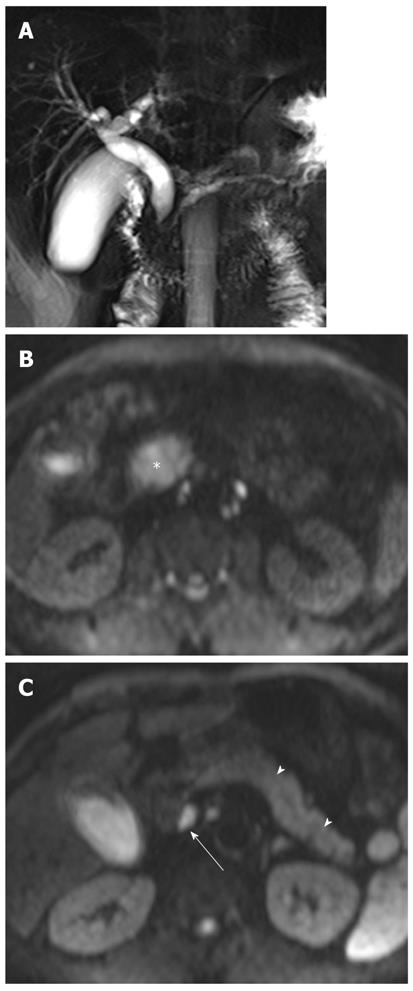
Figure 15 Extrahepatic cholangiocarcinoma in a 62-year-old man.
A: Coronal T2-weighted rapid acquisition relaxation enhancement image shows a mass (arrow) in the distal common bile duct and marked upstream bile duct dilatation; B: DWI at b = 800 s/mm2 shows a mass with high signal intensity (arrow), but the signal intensity of bile is also increased; C: DWI at b = 1000 s/mm2 shows a mass with high signal intensity (arrow). Note that the signal intensity of bile in the bile duct is significantly reduced. DWI: Diffusion-weighted magnetic resonance imaging.
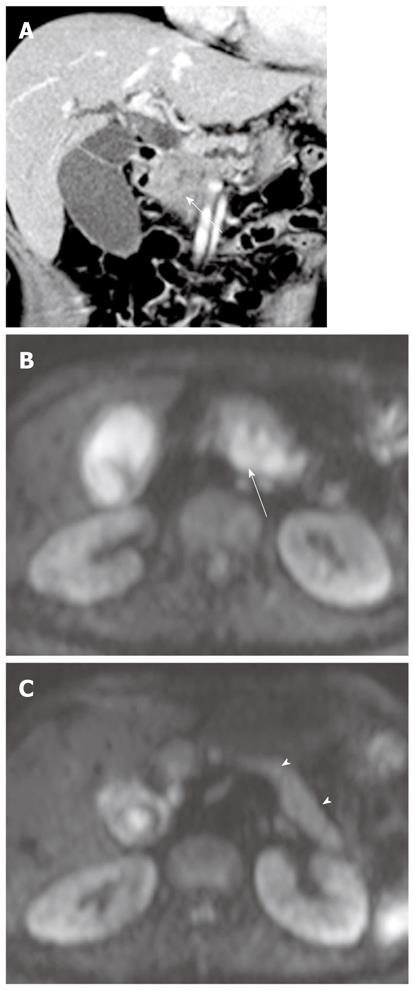
Figure 16 Pancreatic adenocarcinoma in a 50-year-old woman.
A: Coronal reformatted contrast-enhanced CT image shows a double duct sign secondary to a pancreatic head cancer (arrow); B: On DWI at b = 800 s/mm2, pancreatic adenocarcinoma (arrow) shows hyperintensity; C: DWI at b = 800 s/mm2 superior to (B) shows high signal intensity of the remaining pancreas (arrowheads) due to obstructive pancreatitis. However, the remaining pancreas is less hyperintense relative to pancreatic adenocarcinoma. The ADC value of pancreatic cancer (1.23 ± 0.32 mm2/s) is significantly lower than that of the remaining pancreas (1.85 ± 0.45 mm2/s). DWI: Diffusion-weighted magnetic resonance imaging; CT: Computed tomography; ADC: Apparent diffusion coefficient.
Figure 17 Focal pancreatitis in a 52-year-old man.
A: Coronal image from thick-slab single-shot MRCP shows a double duct sign with tapered narrowing of pancreatic duct in the head of the pancreas; B: On DWI at b = 800 s/mm2, focal pancreatitis (asterisk) shows hyperintensity; C: DWI at b = 800 s/mm2 superior to (B) shows high signal intensity of the remaining pancreas due to obstructive pancreatitis. The remaining pancreas is slightly hypointense (arrowheads) relative to pancreatic adenocarcinoma. The ADC value of focal pancreatitis (1.48 ± 0.16 mm2/s) is similar to that of the remaining pancreas (1.54 ± 0.28 mm2/s). Note a hyperintense reactive lymph node (arrow). DWI: Diffusion-weighted magnetic resonance imaging; MRCP: Magnetic resonance cholangiopancreatography; ADC: Apparent diffusion coefficient.
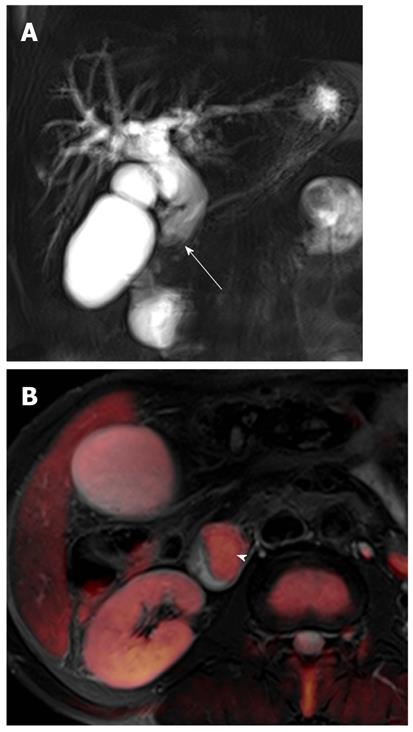
Figure 18 Ampullary carcinoma in a 63-year-old man.
A: Coronal image from thick-slab single-shot MRCP shows marked bile duct dilatation with abrupt narrowing (arrow) at the distal common bile duct; B: Fusion image of T2-weighted and diffusion-weighted imaging at b = 800 s/mm2 shows an ampullary mass with hyperintensity (arrowhead). MRCP: Magnetic resonance cholangiopancreatography.
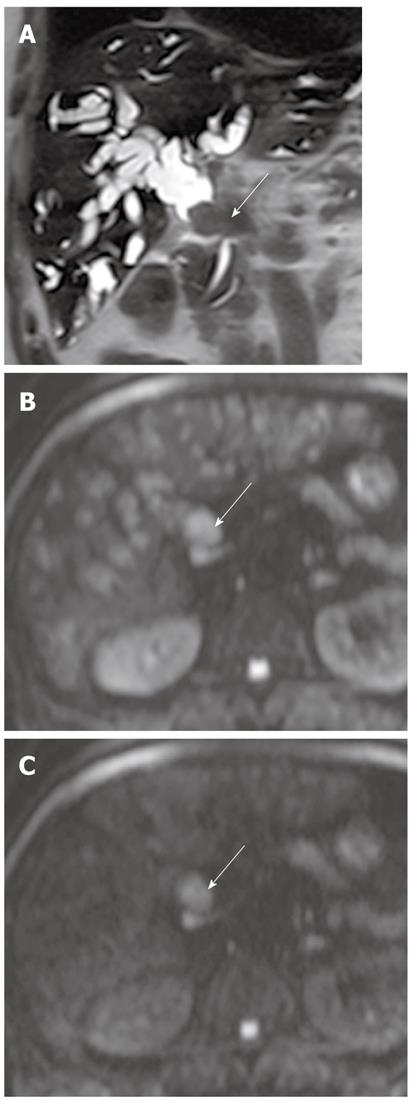
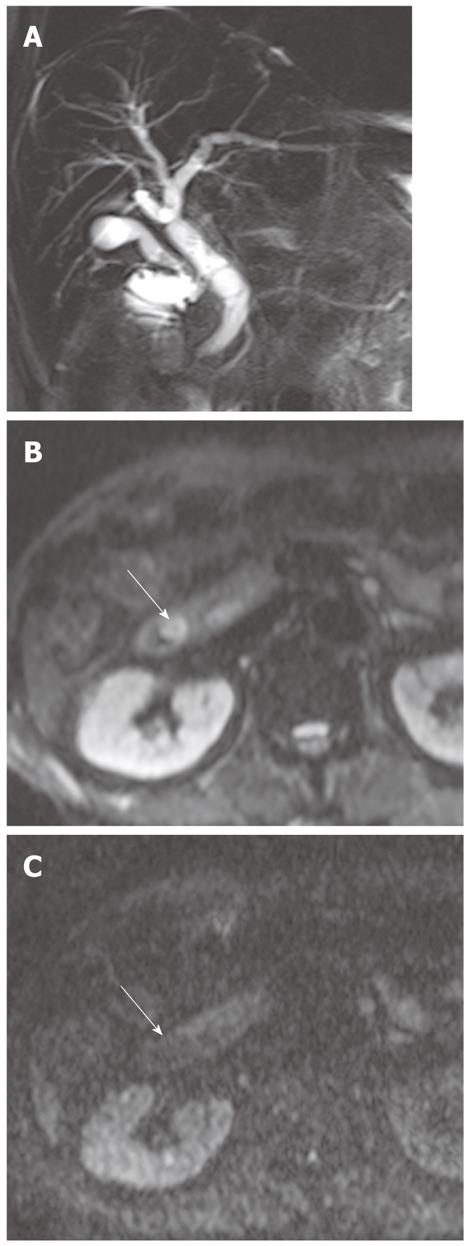
Figure 19 Papillitis due to a recently passed stone in a 75-year-old man.
A: Coronal image from thick-slab single-shot MRCP shows mild bile duct dilatation; B: DWI at b = 50 s/mm2 shows a papilla with high signal intensity (arrow); C: On DWI at b = 800 s/mm2, the signal intensity of the papilla returns to the isosignal intensity (arrow). DWI: Diffusion-weighted magnetic resonance imaging; MRCP: Magnetic resonance cholangiopancreatography.
Figure 20 Hemobilia secondary to percutaneous liver biopsy in a 55-year-old man.
A: DWI at b = 50 s/mm2 shows a hypointense hematoma in the gallbladder (asterisk); B: On DWI at b = 800 s/mm2, signal intensity of the hematoma changes to high signal (asterisk). C: On the ADC map, the hematoma in the gallbladder appears as low signal intensity (asterisk), which is associated with intact RBC membranes (i.e., hyperacute, acute, and early subacute hematomas). DWI: Diffusion-weighted magnetic resonance imaging; ADC: Apparent diffusion coefficient; RBC: Red blood cell.
- Citation: Lee NK, Kim S, Kim GH, Kim DU, Seo HI, Kim TU, Kang DH, Jang HJ. Diffusion-weighted imaging of biliopancreatic disorders: Correlation with conventional magnetic resonance imaging. World J Gastroenterol 2012; 18(31): 4102-4117
- URL: https://www.wjgnet.com/1007-9327/full/v18/i31/4102.htm
- DOI: https://dx.doi.org/10.3748/wjg.v18.i31.4102


