Copyright
©2012 Baishideng Publishing Group Co.
World J Gastroenterol. Aug 14, 2012; 18(30): 3962-3976
Published online Aug 14, 2012. doi: 10.3748/wjg.v18.i30.3962
Published online Aug 14, 2012. doi: 10.3748/wjg.v18.i30.3962
Figure 1 Hematoxylin and eosin staining results for liver tissues from the hepatocellular carcinoma model (A-C) and the control group (D-F).
Normal liver structure and cell morphology were observed in the control group. However, apparent hepatoma nodules (long black arrows, A) and fibrosis (short black arrow, B) in the hepatocellular carcinoma model group were observed when compared with that in the control group.
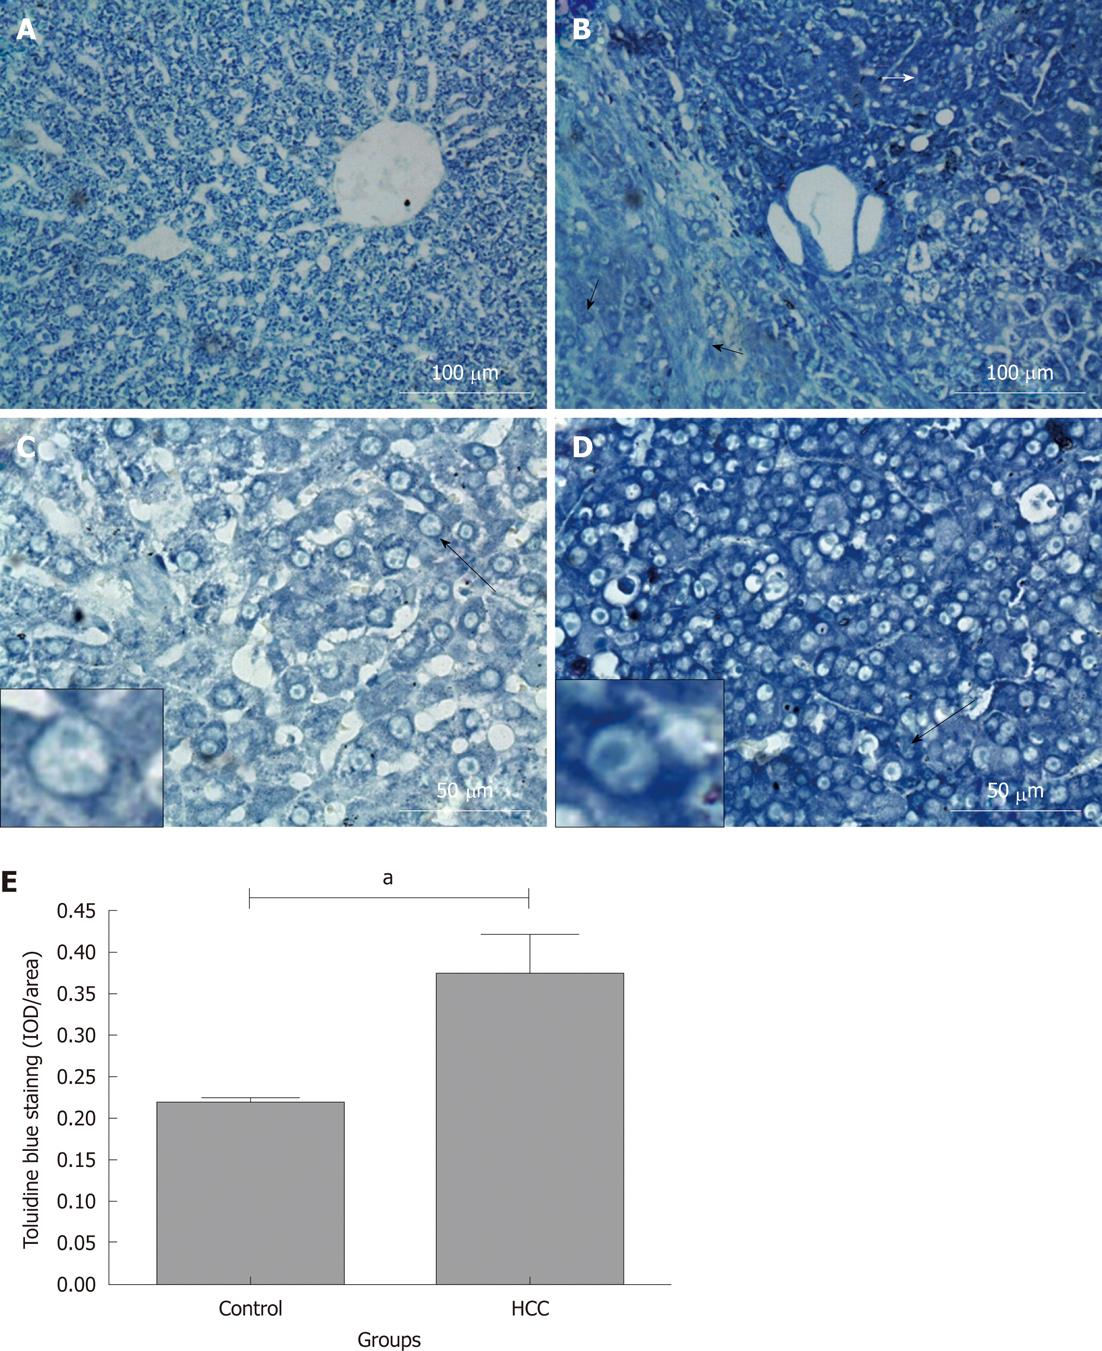
Figure 2 Toluidine blue staining in rat liver tissue sections.
Rats were treated with N-diethylnitrosamine for 16 wk to establish a hepatocellular carcinoma (HCC) animal model. Sulphated glycosaminoglycan content in tissues were stained with Toluidine blue. A and C: Control group; B and D: HCC model group. Long black arrows: The cells are magnified in the small boxes. Short white arrow: Hepatoma tissues with intensive Toluidine blue staining; short black arrow: Weaker Toluidine blue staining fibrosis and “relative normal” liver tissues adjacent to the hepatoma nodules; E: Comparison of average integrated optical density (IOD) of toluidine blue staining in liver tissue between control and HCC model group (aP < 0.05). IOD/area: Integrated optical density per stained area.
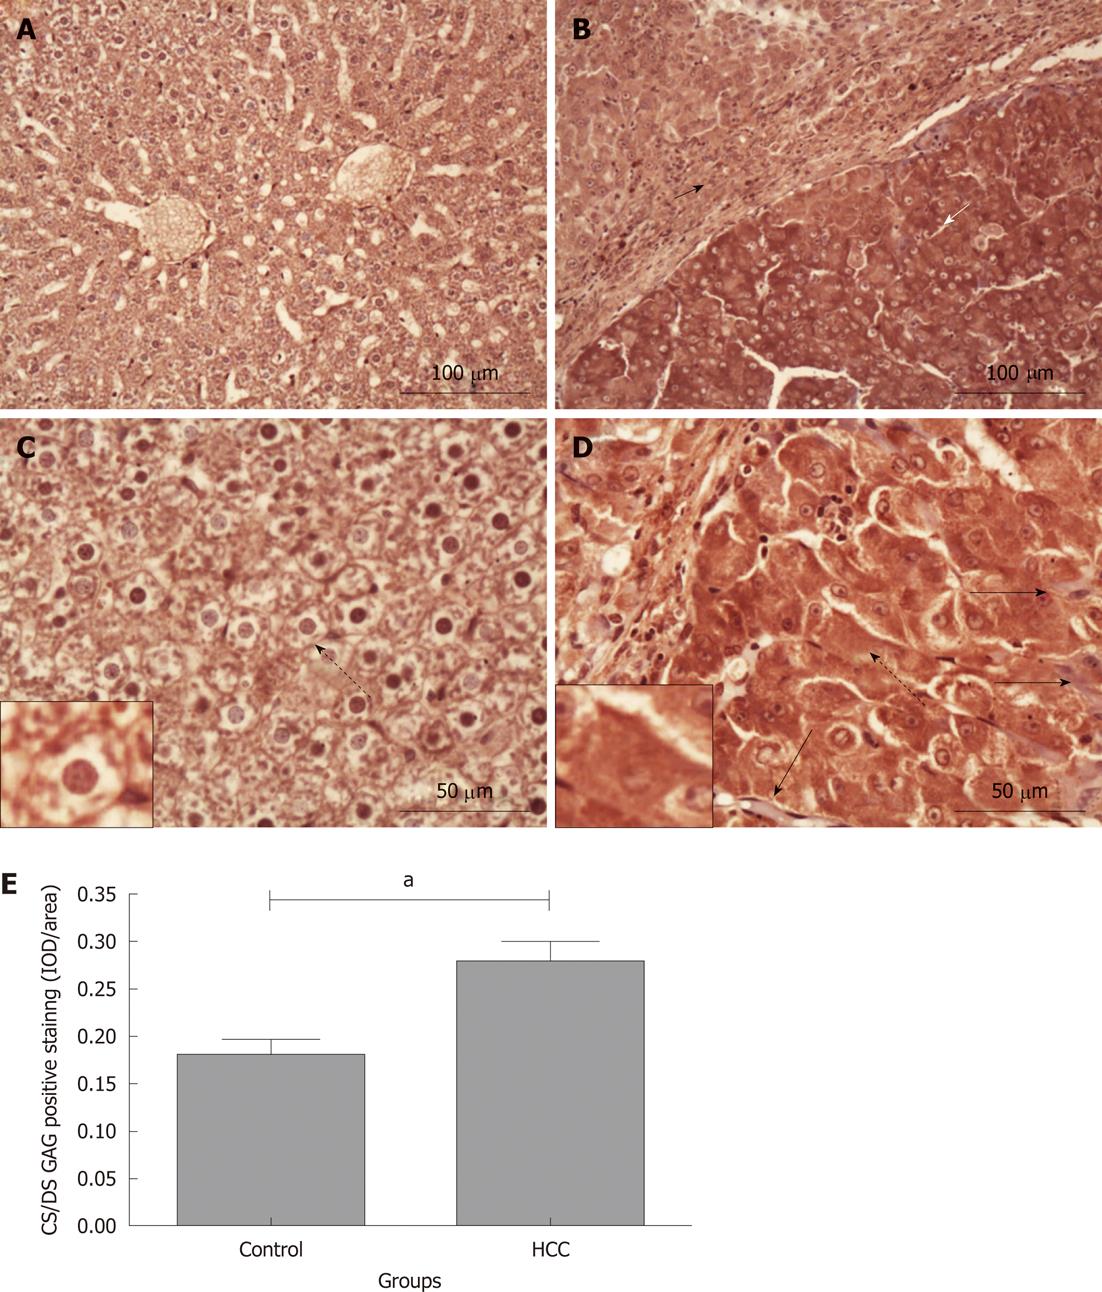
Figure 3 Chondroitin sulphate/dermatan sulphate glycosaminoglycan immunohistochemical staining in rat liver tissues.
Chondroitin sulphate (CS)/dermatan sulphate (DS) sulphated glycosaminoglycan (sGAG) content in liver tissues was stained using 2B6 (+) antibody (dark red). A and C: Control group; B and D: Hepatocellular carcinoma (HCC) model group. Long black arrows: Perisinusoidal cells negatively stained by 2B6 antibody; dotted arrows: The cells are magnified in the small boxes; short white arrow: Hepatoma tissues with intensive CS/DS GAG staining; short black arrow: Weaker CS/DS GAG staining in fibrosis and “relative normal” liver tissues adjacent to the hepatoma nodules; E: Comparison of the average integrated optical density (IOD) in CS/DS GAG positive staining in liver tissues between the control and HCC model groups (aP < 0.05). IOD/area: Integrated optical density per stained area.
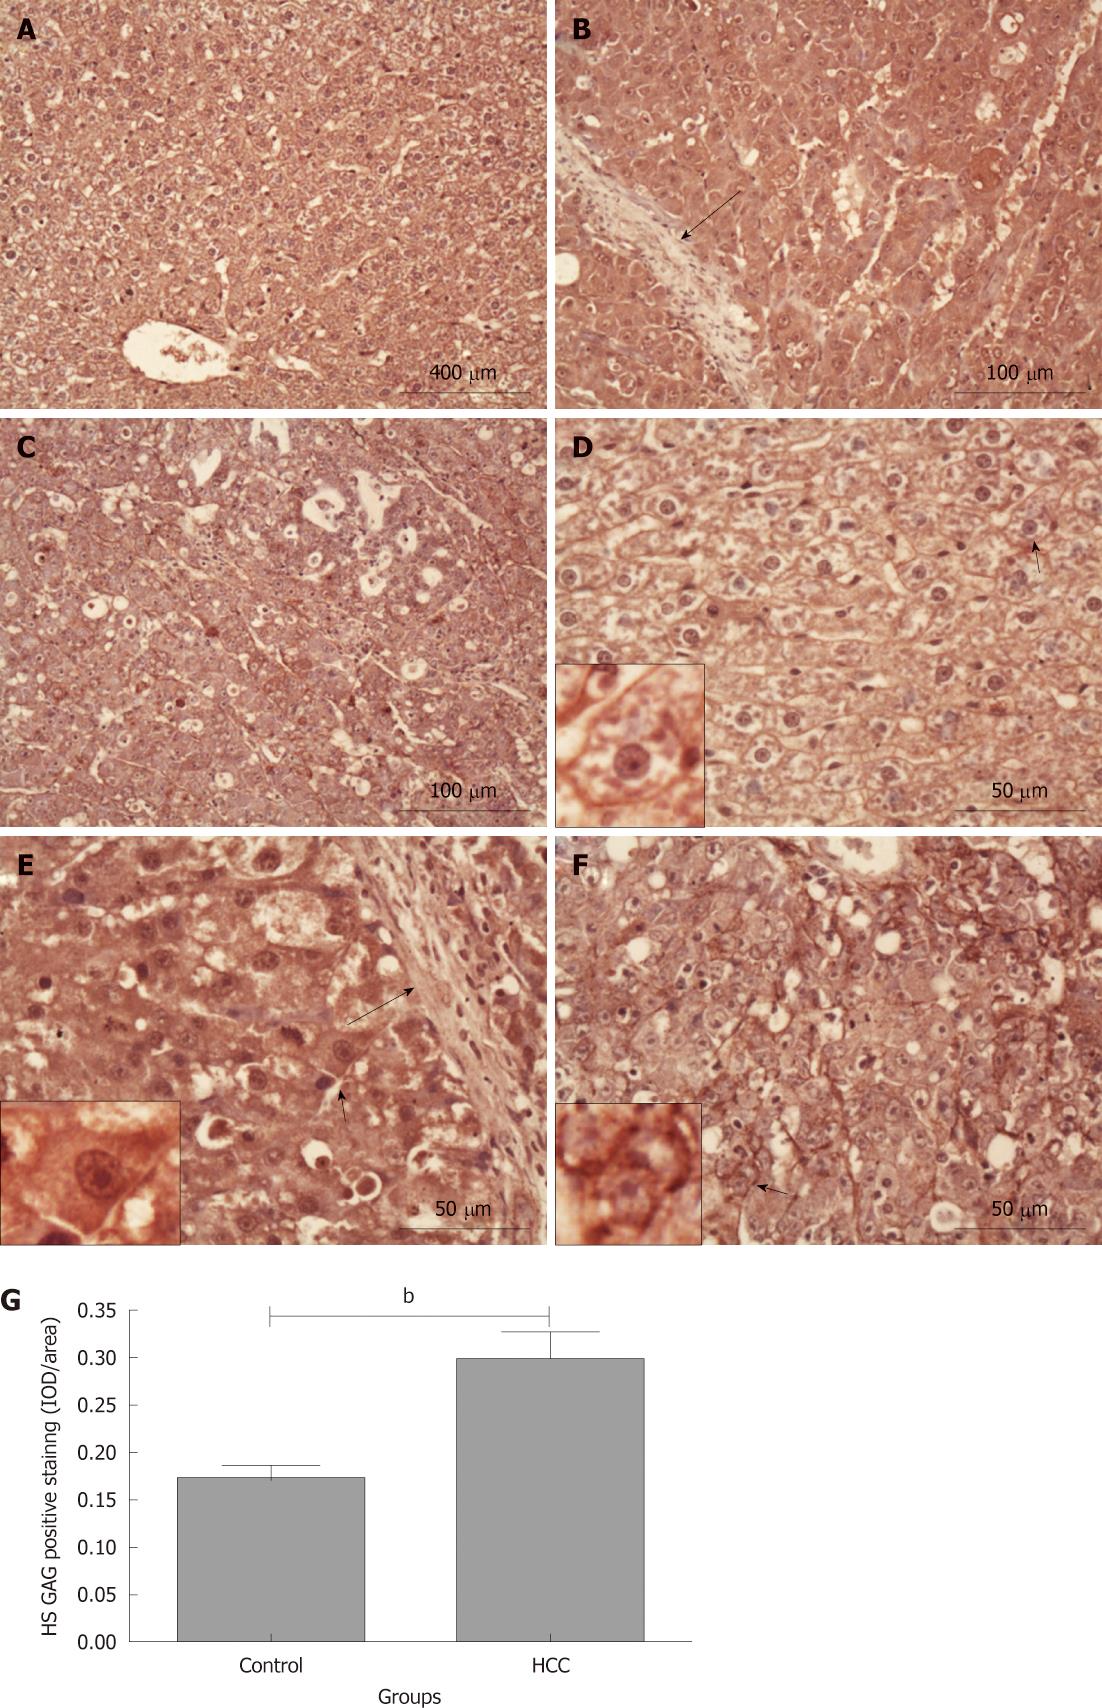
Figure 4 Heparan sulphate glycosaminoglycan staining in rat liver tissues.
Heparan sulphate (HS) glycosaminoglycan (GAG) content in tissue was stained using 10E4 antibody (dark red). A and D: Control group; B and E: Hepatocellular carcinoma (HCC) tissues with intensive HS GAG staining; C and F: HCC tissues with relative weaker HS GAG staining. Long black arrows: Fibrous tissue septa; short black arrows: The cells are magnified in the small boxes; G: Comparison of the average integrated optical density (IOD) in HS GAG positive staining in liver tissues between the control and HCC model groups (bP < 0.01). IOD/area: Integrated optical density per stained area.
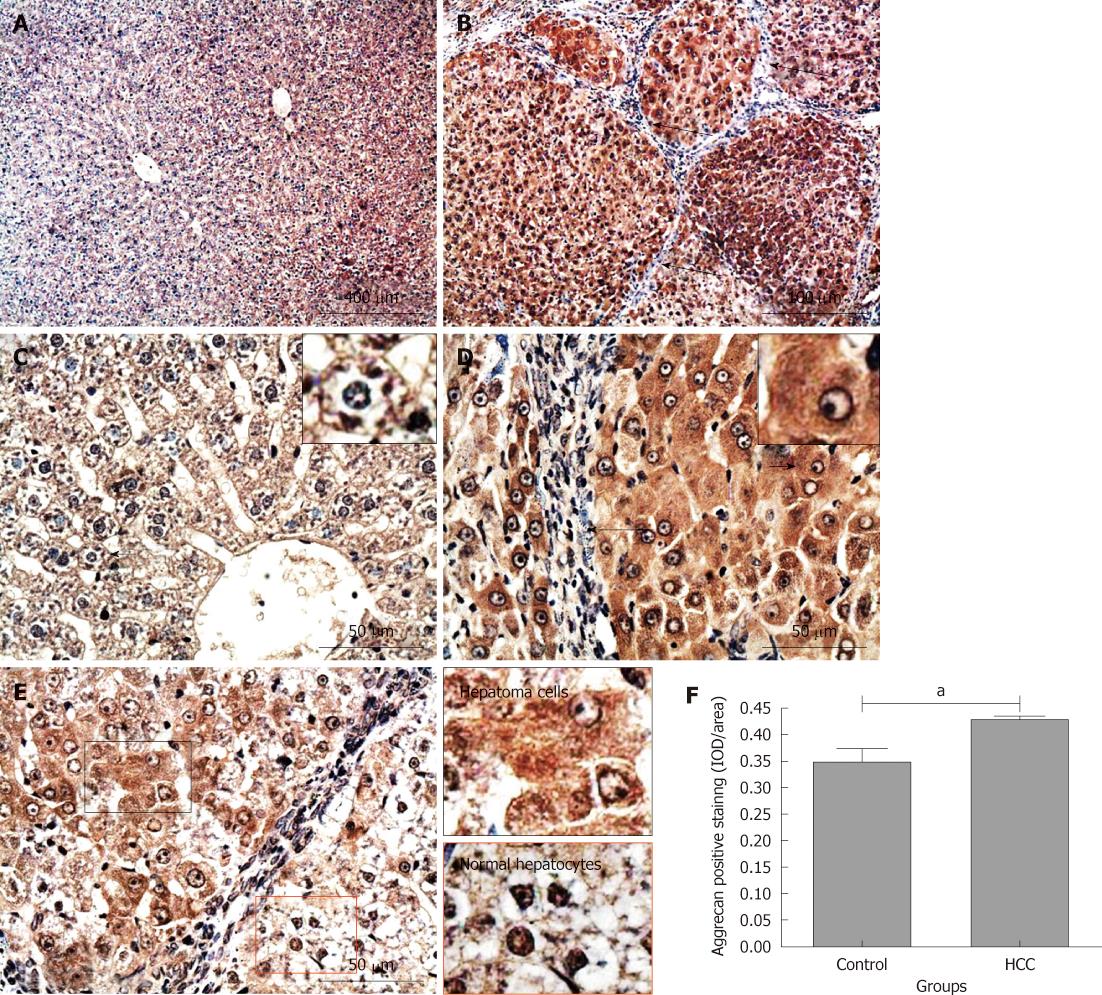
Figure 5 Immunochemical staining for aggrecan in rat liver tissues.
Aggrecan positive staining was dark red. A and C: Control group; B, D and E: Hepatocellular carcinoma (HCC) model group. Long black arrows: Fibrous tissue septa; short black arrows: The cells are magnified in the small boxes; E: Areas in black and red boxes are magnified in left column; F: Comparison of the average integrated optical density (IOD) in aggrecan positive staining in liver tissues between the control and HCC model groups (aP < 0.05). IOD/area: Integrated optical density per stained area.
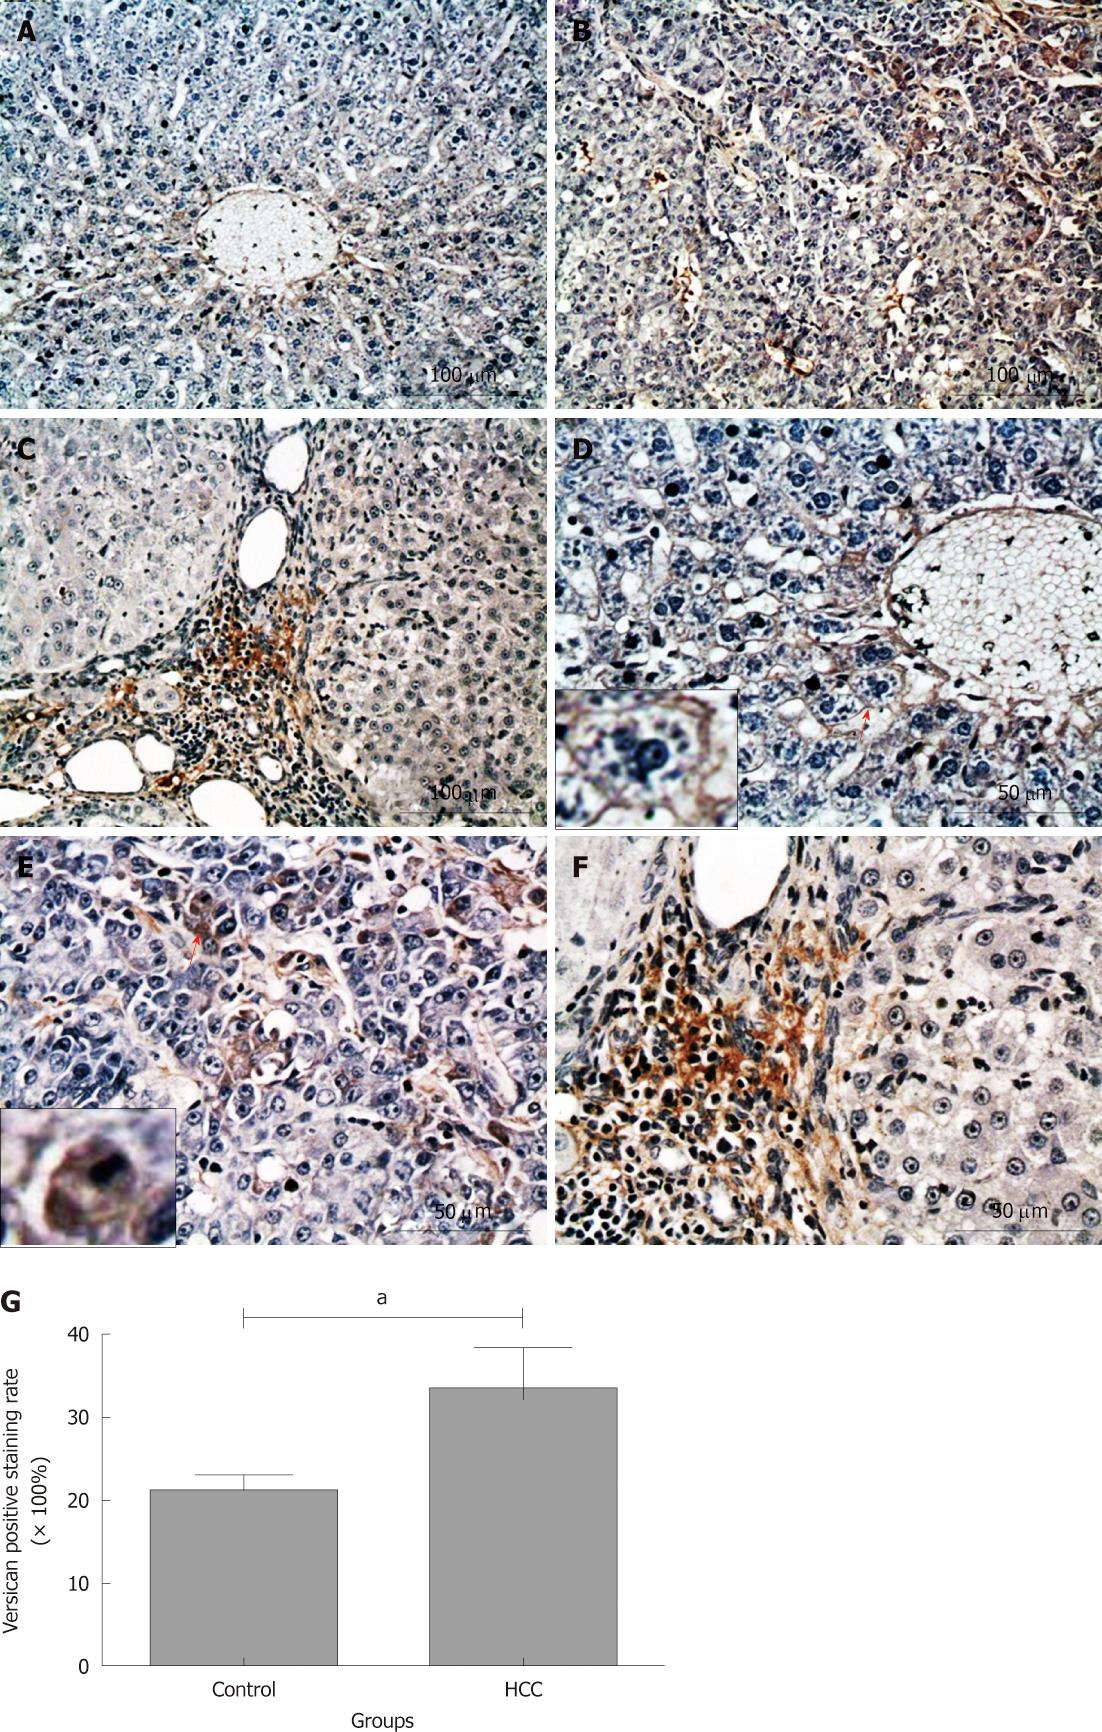
Figure 6 Immunochemical staining for versican in rat liver tissues.
Versican positive staining was dark red. A-F: Most of hepatocytes were negatively stained in control group (A and D), whereas more hepatoma cells in hepatocellular carcinoma (HCC) nodules were positively stained (B and E); however, the strongest versican positive staining was observed in the fibrosis septa between hepatoma nodules (C and F). Short red arrows: The cells are magnified in the small boxes; G: Comparison of the positive rate for versican staining in liver tissues between the control and HCC model groups. aP < 0.05.
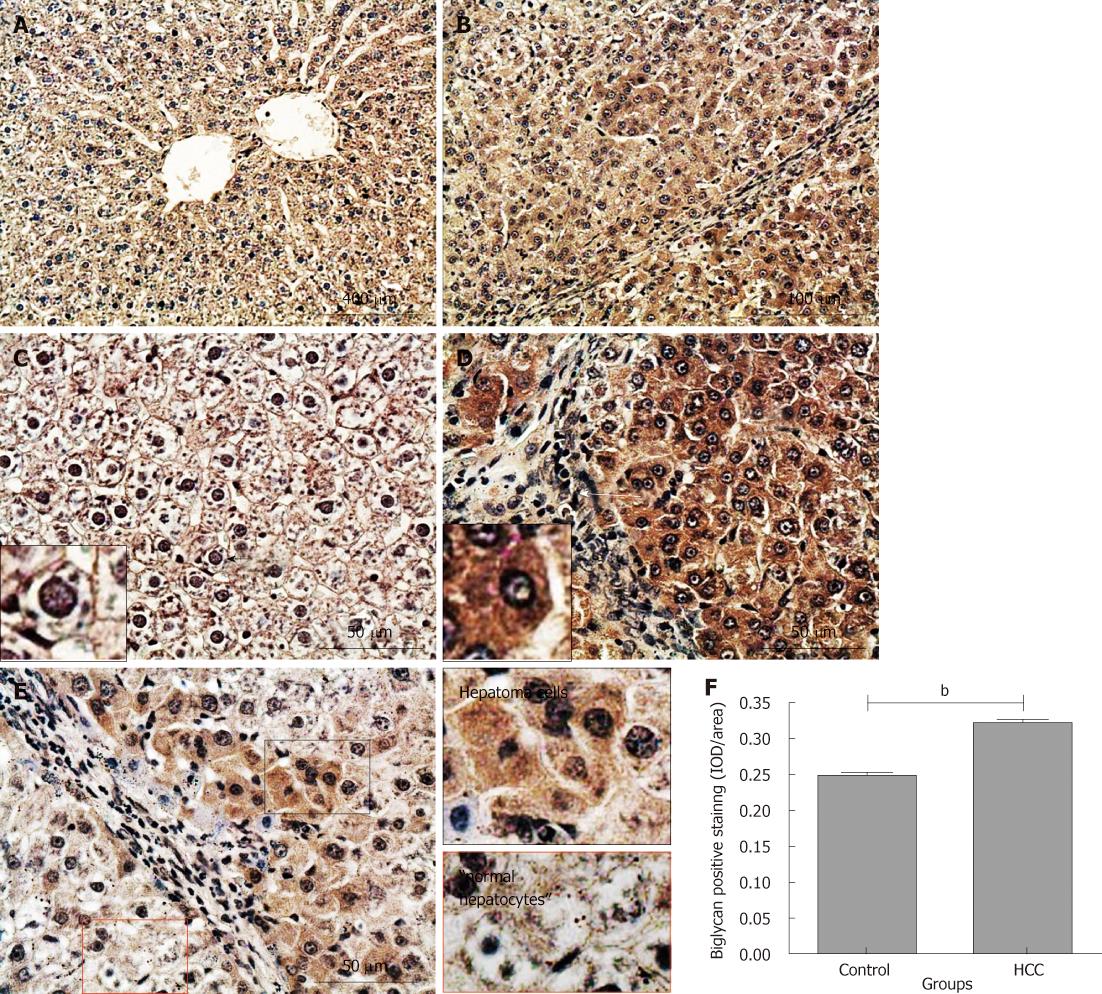
Figure 7 Immunochemical staining for biglycan in rat liver tissues.
Biglycan positive staining was dark red. A and C: Control group; B, D and E: Hepatocellular carcinoma (HCC) model group. Long white arrow: Fibrous tissue septa; short black and white arrows: The cells are magnified in the small boxes; E: Areas in black and red boxes are magnified in left column; F: Comparison of the average integrated optical density (IOD) in biglycan positive staining in liver tissues between the control and HCC model groups (bP < 0.001). IOD/area: Integrated optical density per stained area.
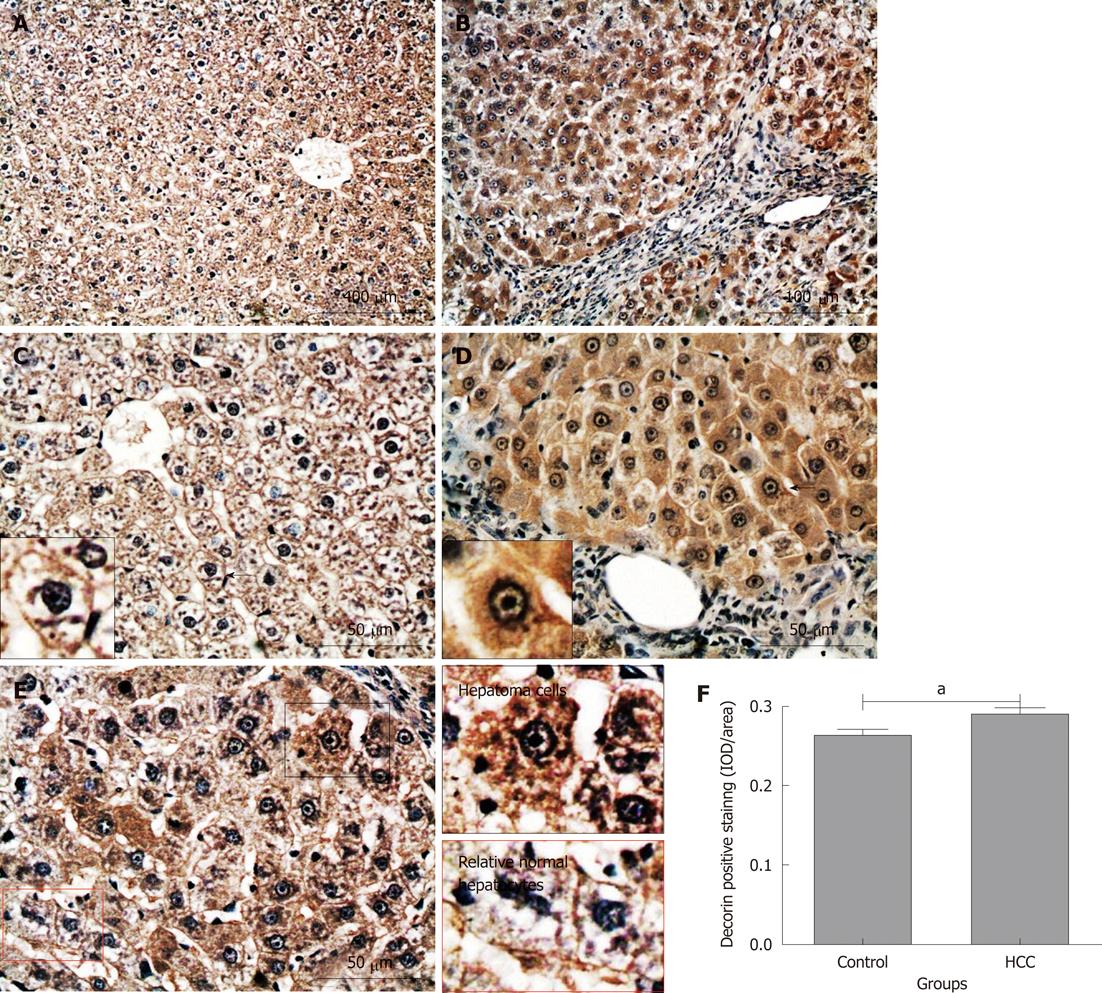
Figure 8 Immunochemical staining for decorin in rat liver tissues.
Decorin positive staining was dark red. A and C: Control group; B, D and E: Hepatocellular carcinoma (HCC) model group. Short black arrows: The cells are magnified in the small boxes; E: Areas in black and red boxes are magnified in left column; F: Comparison of the average integrated optical density (IOD) in decorin positive staining in liver tissues between the control and HCC model groups (aP < 0.05). IOD/area: Integrated optical density per stained area.
- Citation: Jia XL, Li SY, Dang SS, Cheng YA, Zhang X, Wang WJ, Hughes CE, Caterson B. Increased expression of chondroitin sulphate proteoglycans in rat hepatocellular carcinoma tissues. World J Gastroenterol 2012; 18(30): 3962-3976
- URL: https://www.wjgnet.com/1007-9327/full/v18/i30/3962.htm
- DOI: https://dx.doi.org/10.3748/wjg.v18.i30.3962


