Copyright
©2012 Baishideng Publishing Group Co.
World J Gastroenterol. Jan 21, 2012; 18(3): 268-274
Published online Jan 21, 2012. doi: 10.3748/wjg.v18.i3.268
Published online Jan 21, 2012. doi: 10.3748/wjg.v18.i3.268
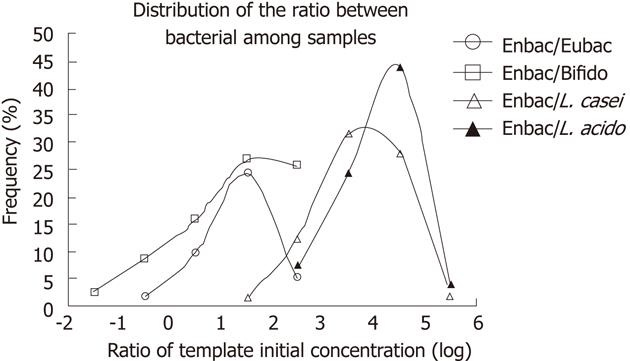
Figure 2 Distributions of ratio between each two bacteria.
Enterobacterium was used to compare with other four species, respectively. The abscissa is the ratio of template concentration, divided into a 10-fold section. The ordinate is the frequency of each ratio section between two species. Enbac: Enterobacterium; Eubac: Eubacterium; Bifido: Bifidobacterium; L. casei: Lactobacillus casei; L. acido: Lactobacillus acidophilus.
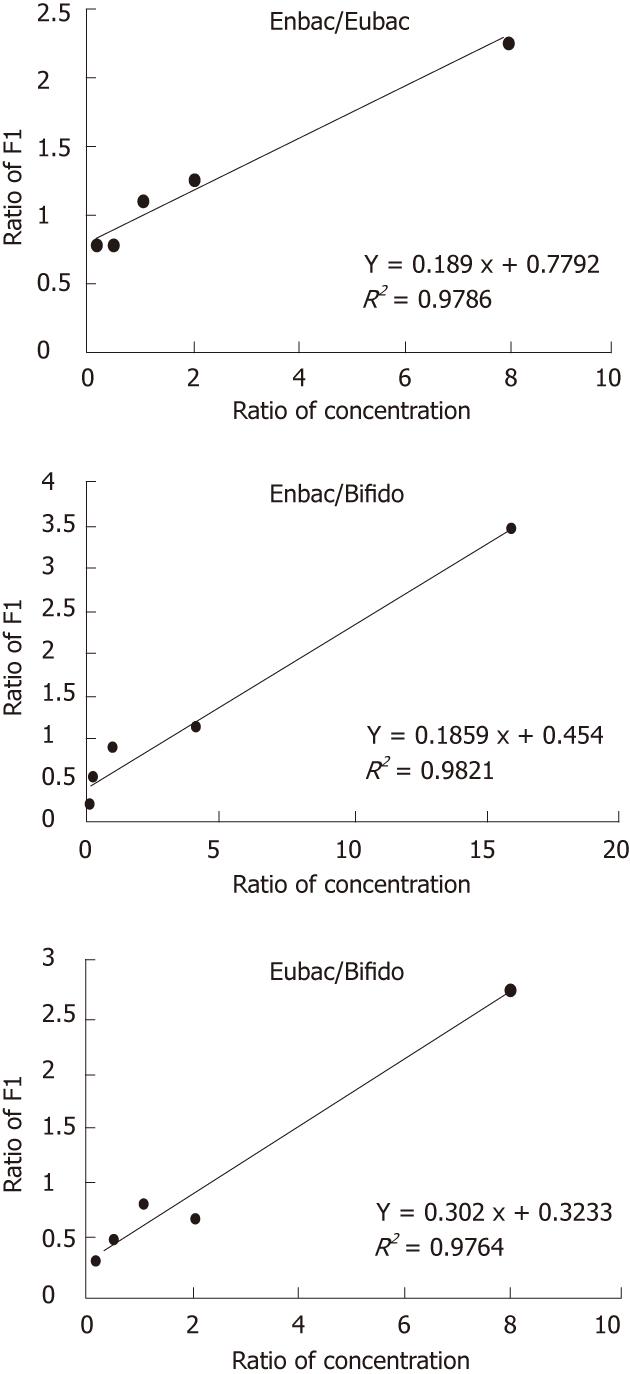
Figure 1 Linear relationship between the initial template concentrations and fluorescence signal intensity of ligase detection reaction/ligase chain reaction in standard curve test.
The results of Enterobacterium (Enbac)/Eubacterium (Eubac), Enbac/Bifidobacterium (Bifido) and Eubac/Bifido tested by ligase detection reaction probes were presented. The linearity analyses were done twice, and results had a high reproducibility (data not shown).
- Citation: Tang ZR, Li K, Zhou YX, Xiao ZX, Xiao JH, Huang R, Gu GH. Comparative quantification of human intestinal bacteria based on cPCR and LDR/LCR. World J Gastroenterol 2012; 18(3): 268-274
- URL: https://www.wjgnet.com/1007-9327/full/v18/i3/268.htm
- DOI: https://dx.doi.org/10.3748/wjg.v18.i3.268


