Copyright
©2012 Baishideng Publishing Group Co.
World J Gastroenterol. Jul 28, 2012; 18(28): 3681-3695
Published online Jul 28, 2012. doi: 10.3748/wjg.v18.i28.3681
Published online Jul 28, 2012. doi: 10.3748/wjg.v18.i28.3681
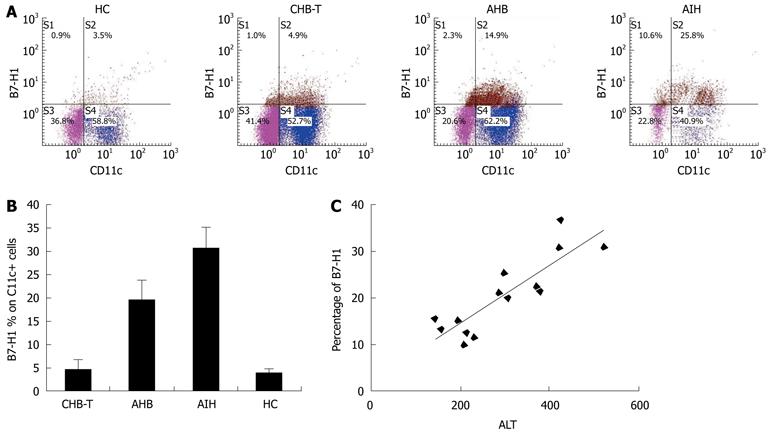
Figure 1 Circulating human B7 homolog 1 expression comparison among acute hepatitis B, chronic hepatitis B virus tolerance and autoimmune hepatitis patients.
A: Representative dot plots of double measurements of fifteen independent experiments; B: B7 homolog 1 (B7-H1) expression level on circulating myeloid dendritic cells (mDCs) of acute hepatitis B (AHB) patients was significantly higher than that in chronic hepatitis B virus tolerance (CHB-T) patients (n = 12, P < 0.05). Autoimmune hepatitis (AIH) patients exhibited the highest levels of B7-H1 expression on circulating mDCs among these groups (n = 3, P < 0.05); C: In AHB patients, there was significant, positive correlation between B7-H1 expression on mDCs and serum alanine aminotransferase (ALT) levels in AHB patients (r = 0.809). HC: Healthy controls.
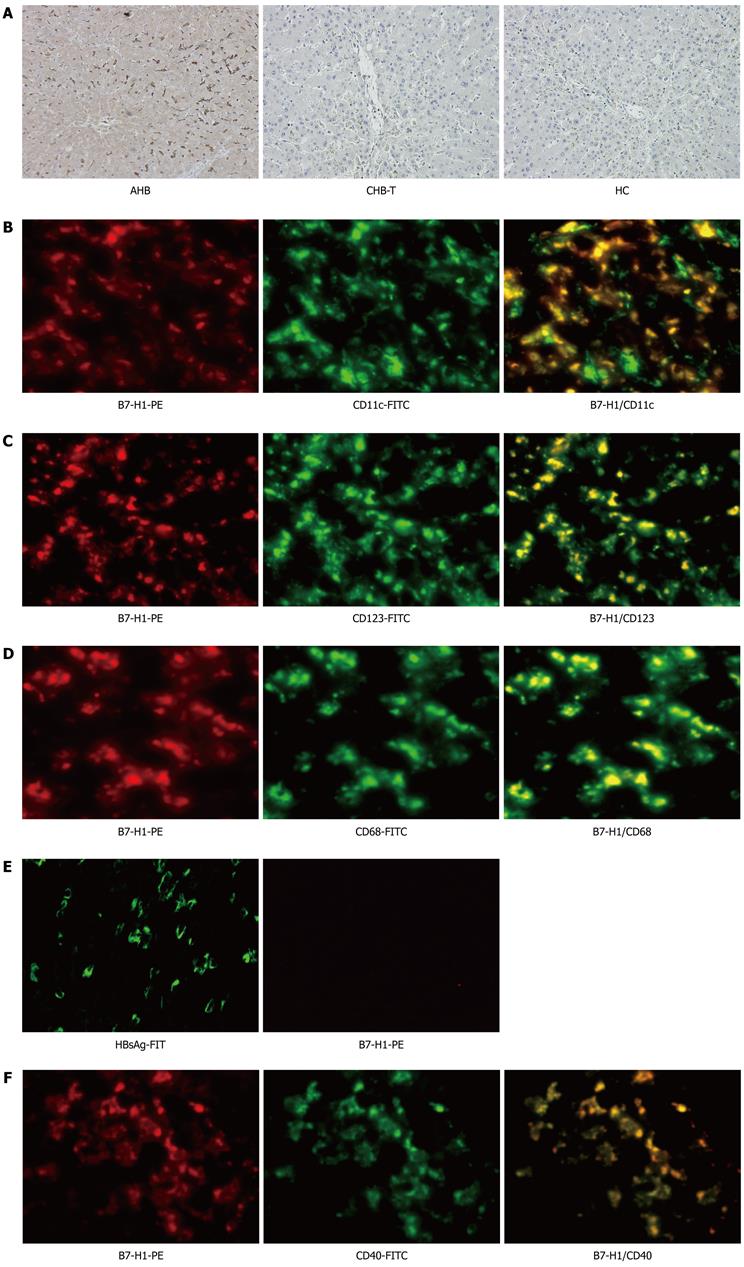
Figure 2 Analysis of intrahepatic human B7 homolog 1 expression among acute hepatitis B and chronic hepatitis B virus tolerance patients.
A: Immunohistochemical staining for intrahepatic B7 homolog 1 (B7-H1)-positive cells in acute hepatitis B (AHB), chronic hepatitis B virus tolerance (CHB-T) and healthy controls (HC). Intra-hepatic B7-H1 expression was up-regulated significantly in AHB patients, but was almost absent in both CHB-T and HC subjects. Original magnification × 200; B-D: Co-localization of B7-H1 with CD11c, CD123 and CD68 were shown by immunofluorescence double staining in liver biopsy specimens of AHB patients. B7-H1 (red) is co-localized with CD11c (green) positive mDCs (B), CD123 (green) positive pDCs (C) or CD68 (green) positive Kupffer cells (D). The 2-color merged panels were shown with co-localization visible in yellow. Original magnification × 200; E: Hepatitis B surface antigen (HBsAg) and B7-H1 expression was detected by immunofluorescence stain in the liver tissue of CHB-T patients. Original magnification × 200; F: Colocalization of B7-H1 with CD40 is showed by immunofluorescence double staining in liver biopsy specimens of AHB patients. B7-H1 (red) is colocalized with CD40 (green). The 2-color merged panels were shown with colocalization visible in yellow. Original magnification × 200. PE: Phycoerythrin; FITC: Fluorescein isothiocyanate.
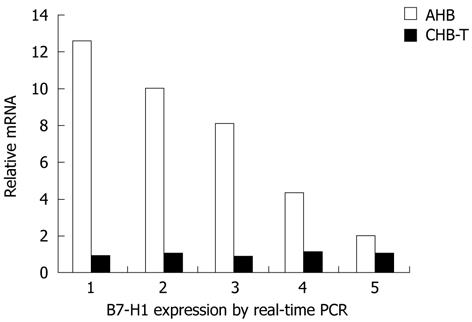
Figure 3 Quantitative real-time reverse transcription-polymerase chain reaction was performed in 5 acute hepatitis B and hepatitis B virus tolerance patients.
Acute hepatitis B (AHB) and chronic hepatitis B virus tolerance (CHB-T) patients were matched freely. B7 homolog 1 (B7-H1) mRNA expression level was significantly higher in AHB than in CHB-T liver tissue (n = 5, P < 0.01). PCR: Polymerase chain reaction.
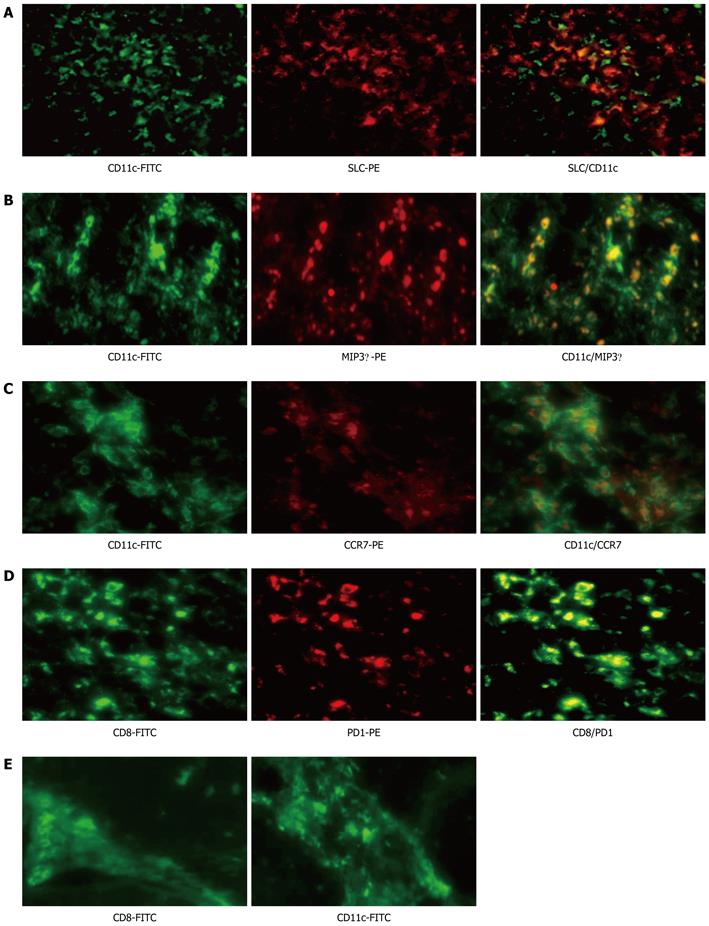
Figure 4 Localization of CD11c and programmed death 1 in liver tissue from acute hepatitis B and chronic hepatitis B virus tolerance patients.
A-C: Colocalization of CD11c with SLC, MIP3α and CCR7 by immunofluorescence double staining in liver biopsy specimens of acute hepatitis B (AHB) patients. CD11c (green) is co-localized with SLC (red) (A), MIP3α (red) (B) and CCR7 (red) (C). The 2-color merged panels were shown with colocalization visible in yellow. Original magnification × 200; D: Colocalization of CD8 with programmed death 1 (PD1) by immunofluorescence double staining in liver biopsy specimens of AHB patients. CD8 (green) is co-localized with PD1 (red). Original magnification × 200; E: Inflammatory cells, such as CD8 and CD11c positive cells, can be observed mainly in fibrous septa in the liver tissue of chronic hepatitis B virus tolerance patients. FITC: Fluorescein isothiocyanate; PE: Phycoerythrin; SLC: Secondary lymphoid tissue chemokine; MIP3α: Macrophage inflammatory protein 3 α; CCR: Chemokine (C-C) receptor.
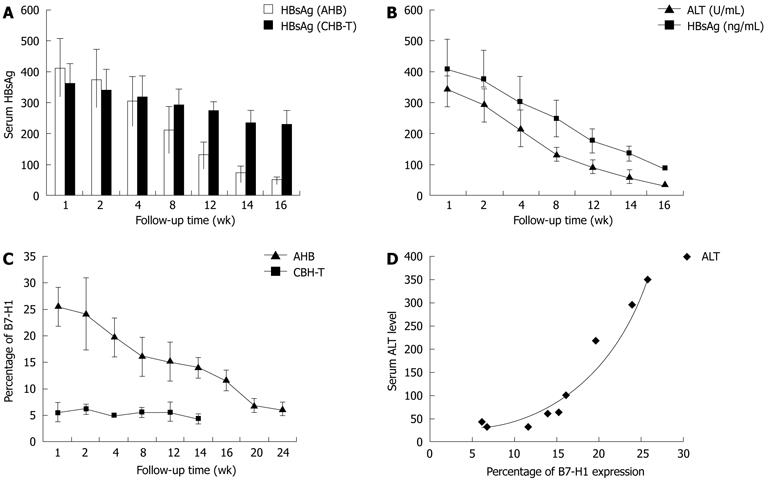
Figure 5 Longitudinal analysis of serum hepatitis B surface antigen, alanine aminotransferase levels and human B7 homolog 1 expression in acute hepatitis B and chronic hepatitis B virus tolerance patients.
A: In acute hepatitis B (AHB) patients, serum hepatitis B surface antigen (HBsAg) levels decreased significantly from 404 ± 98.3 ng/mL at the 1st week to less than 30 ng/mL at the 16th week. In chronic hepatitis B virus tolerance (CHB-T) patients, serum HBsAg load remained more than 231 ± 38.6 ng/mL at the 16th week; B: In AHB patients, accompanied by a decrease in serum HBsAg level, serum alanine aminotransferase (ALT) level decreased significantly from 346.5 ± 62.3 at the 1st week to 41.8 ± 82 at the 16th week; C: In AHB patients, followed by a decrease in serum HBsAg and ALT level, the percentage of B7 homolog 1 (B7-H1) positive cells decreased significantly from 25.7 ± 4.0 at the 1st week to 6.3 ± 1.37 at the 24th week. In CHB-T patients, B7-H1 expression levels were not increased significantly during the follow-up period; D: In AHB patients, positive correlation between B7-H1 expression on circulating CD11c + DCs and serum ALT levels was revealed by longitudinal correlation analysis (r = 0.902).
Figure 6 Human B7 homolog 1 expression on circulating CD11c positive cells in three chronic active hepatitis B patients during the inflammatory flare phase.
The percentage of B7 homolog 1 (B7-H1) expression on circulating CD11c+ cells increased significantly in all three patients during the inflammatory flare phase. The numbers in the upper right quadrants indicate the percentage of B7-H1 positive CD11c+ dendritic cells. PE: Phycoerythrin.
Figure 7 In vitro kinetic analysis of CD40 and human B7 homolog 1 expression on myeloid dendritic cells, with or without hepatitis B surface antigen pretreatment, stimulated by poly (I:C).
A: The FSC and SSC of myeloid dendritic cells (mDCs) with r hepatitis B surface antigen (HBsAg) pretreatment were not altered significantly compared to those without rHBsAg pretreatment. This result suggests that the vitality of mDCs with or without HBsAg pretreatment is similar; B: Representative plots of CD40 and B7 homolog 1 (B7-H1) expression on mDCs with or without HBsAg pretreatment. Values in the upper right quadrant indicate the percentage of CD40 or B7-H1 positive cells; C: With HBsAg pretreatment, the percentage of CD40 (left) and B7-H1 (right) positive cells within mDCs were decreased significantly at 16 h, 20 h and 24 h time points (for CD40, aP < 0.05 at 16 h, 20 h and 24 h time point; for B7-H1, cP < 0.05 at 16 h and 24 h time point, n = 10); D: With HBsAg pretreatment, the MFI of CD40 (left) and B7-H1 (right) were decreased significantly at 16 h and 20 h time points ( for CD40 and B7-H1, aP < 0.05 at 16 h, 20 h and 24 h time point, n = 10); E: The inhibition rate was calculated using following equation: 1-MFI of CD40 or B7H1 with HBsAg pretreatment/MFI of CD40 or B7H1 without HBsAg pretreatment. The results showed that at 8 h, 16 h, 20 h and 24 h time point, the inhibition rate of CD40 was greater significantly than that of B7H1 (P < 0.05 at 8 h time point, P < 0.01 at 16 h time point, P < 0.05 at 20 h time point, P < 0.01 at 24 h time point). MFI: Mean fluorescence intensity; FSC: Forward scatter; SCC: Side scatter.
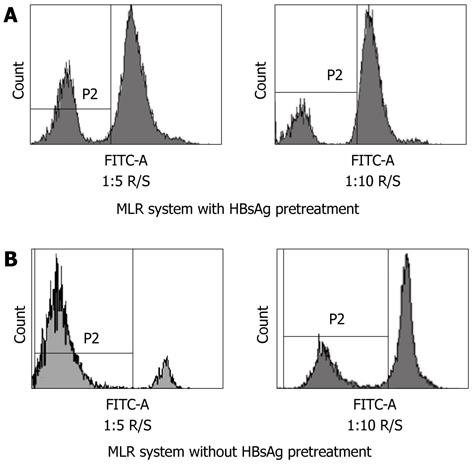
Figure 8 The analysis of the effects of hepatitis B surface antigen on T cell proliferation by carboxyfluorescein diacetate succinimidyl ester labeled mixed leucocyte reaction.
A: Myeloid dendritic cells (mDCs) with hepatitis B surface antigen (HBsAg) pretreatment are weak stimulators in the mixed leucocyte reaction (MLR). Approximately 25.4% of T cells are carboxyfluorescein diacetate succinimidyl ester (CFSE)dim in 1:5 R/S ratio and 12.0% in 1:10 R/S ratio respectively; B: mDCs without HBsAg pretreatment are potent stimulators in the MLR. Approximately 85.1% of the T cells are CFSEdim in 1:5 R/S ratio and 30.3% in 1:10 R/S ratio respectively. FITC: Fluorescein isothiocyanate. R/S: Responder cell-stimulator cell.
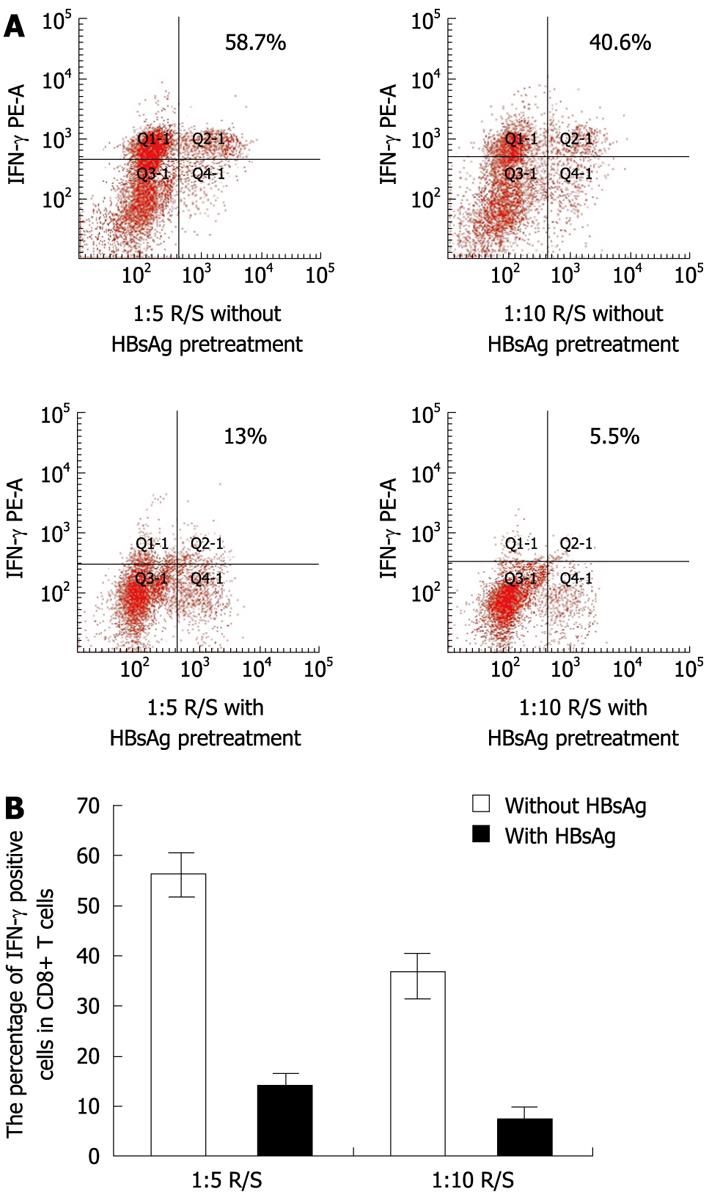
Figure 9 The analysis of the effects of hepatitis B surface antigen on intracellular interferon-γ production.
A: Representative plots of intracellular interferon-γ (IFN-γ) produced by CD8+ T cells in mixed leucocyte reaction (MLRs) with or without hepatitis B surface antigen (HBsAg) pretreatment. Values in the upper right quadrant indicate the percentage of IFN-γ positive CD8+ T cells; B: In MLRs system at ratios of 1:5 and 1:10 R/S, IFN-γ production by CD8+T cells was reduced significantly by HBsAg pretreatment (at ratios of 1:5 and 1:10 R/S, P < 0.001, n = 3). R/S: Responder cell-stimulator cell.
- Citation: Zhang WJ, Xie HY, Duan X, Wan YL, Peng CH, Shi SH, Su R, Zheng ZH, Pan LL, Zhou L, Zheng SS. Study of human B7 homolog 1 expression in patients with hepatitis B virus infection. World J Gastroenterol 2012; 18(28): 3681-3695
- URL: https://www.wjgnet.com/1007-9327/full/v18/i28/3681.htm
- DOI: https://dx.doi.org/10.3748/wjg.v18.i28.3681


