Copyright
©2012 Baishideng Publishing Group Co.
World J Gastroenterol. Jul 14, 2012; 18(26): 3379-3388
Published online Jul 14, 2012. doi: 10.3748/wjg.v18.i26.3379
Published online Jul 14, 2012. doi: 10.3748/wjg.v18.i26.3379
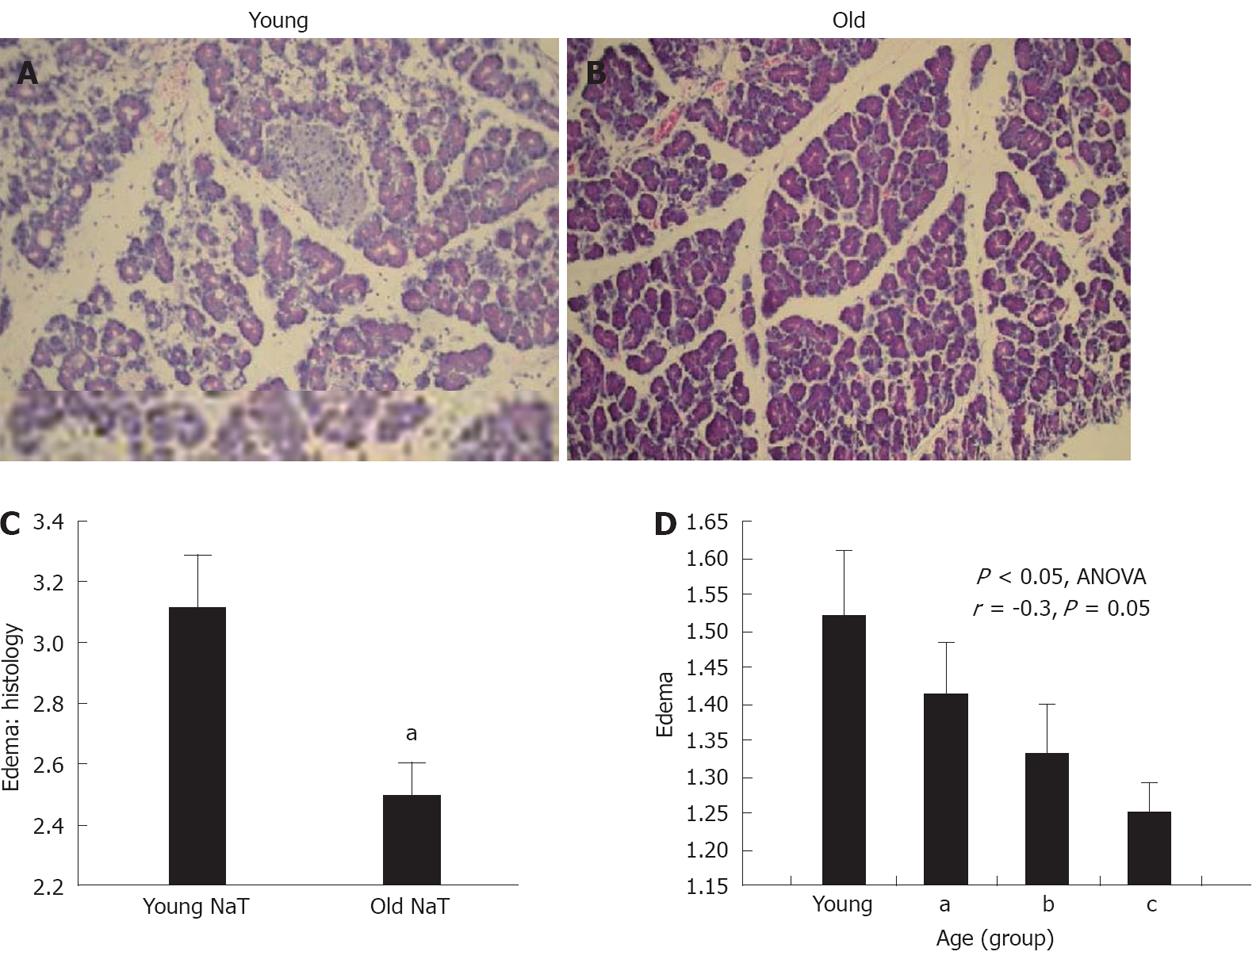
Figure 1 Effect of age on pancreatic edema 24 h after induction of sodium taurocholate pancreatitis.
A: A young rat with severe, grade 4 edema [hematoxylin and eosin (H and E), 40×]; B: An old rat with moderate, grade 3 edema (H and E, 40×); C: Mean ± SE histologic scoring of edema for both groups; D: Edema data calculated by wet:dry ratio of pancreatic tissue. While young vs old ratios are discussed in the text, when animals were sorted into young, aged (group a), very aged (group b) and most aged (group c) groups, a progressive decrease in edema was seen with age. A significant negative correlation was also noted (aP < 0.05, Student’s t test). NaT: Sodium taurocholate; ANOVA: Analysis of variance.
Figure 2 Histology (hematoxylin and eosin, 100×) of young (panel A) and old (panel B) inflammatory infiltrates 24 h after induction of sodium taurocholate pancreatitis.
A: Severe, grade 4 parenchymal inflammation in the young animal; B: Mild, grade 2 inflammation in an older one.
Figure 3 Histologic scores.
There was no difference in necrosis scores between young and old (C), but significant decreases were observed in inflammatory infiltrates of the parenchymal (D) and stromal (E) tissue (aP < 0.05, Student’s t test). NaT: Sodium taurocholate.
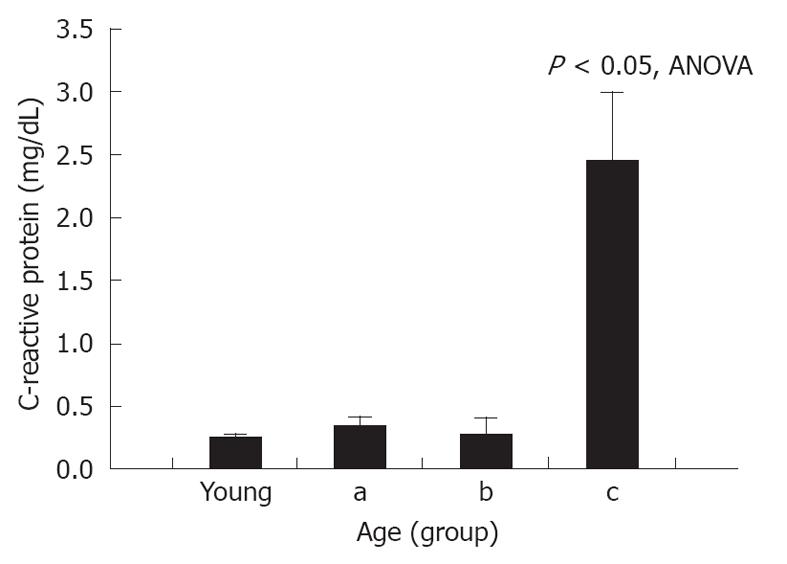
Figure 4 Effect of age on serum C-reactive protein level 24 h after induction of sodium taurocholate pancreatitis.
Data for young vs old animals were not significantly different and are shown in the text and Table 1. However, when animals were sorted into young, and subgroups of aged (subgroup a), very aged (subgroup b) and most aged (subgroup c), a significant increase in C-reactive protein was seen in the most aged group (subgroup c). ANOVA: Analysis of variance.
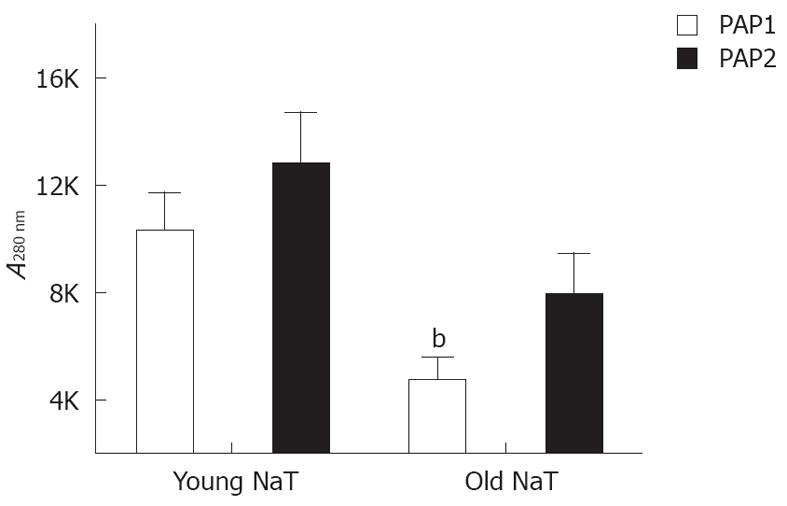
Figure 5 Western blotting analysis of pancreatitis-associated protein 1 and pancreatitis-associated protein 2 protein levels from pancreatic tissue 24 h after induction of sodium taurocholate pancreatitis.
Both decreased with age, with statistical significance in the pancreatitis-associated protein (PAP)1 group (bP = 0.003), and near significance in the PAP2 group (P = 0.06). Units are based on densitometry and expressed as intensity × area (mm2). NaT: Sodium taurocholate.
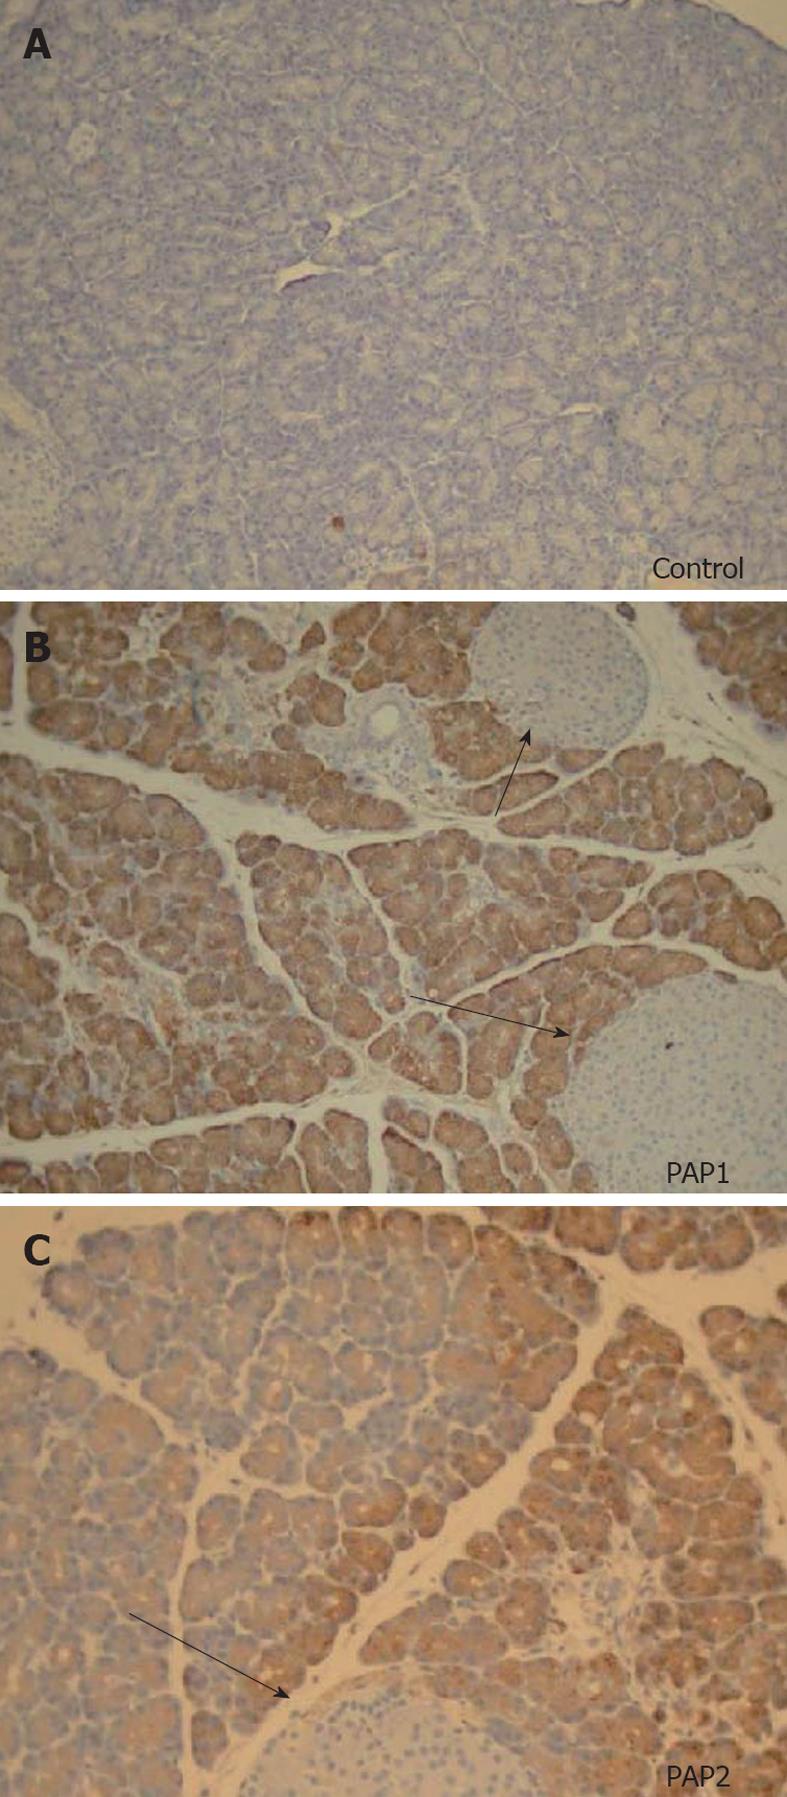
Figure 6 Immunohistochemistry for pancreatitis-associated proteins (40×) in a young control animal without pancreatitis (A) compared to pancreatitis-associated protein 1 (B) and pancreatitis-associated protein 2 (C) in young animals 24 h after sodium taurocholate pancreatitis.
No staining is seen in controls, uniform brown colored staining is seen for pancreatitis-associated protein (PAP)1 (B). Preparation of the slides was done side by side. A different, heterogenous pattern of staining is seen for PAP2 (C). Note that islets of Langerhans (arrows) do not stain at all for PAPs in normal animals or animals with acute pancreatitis.
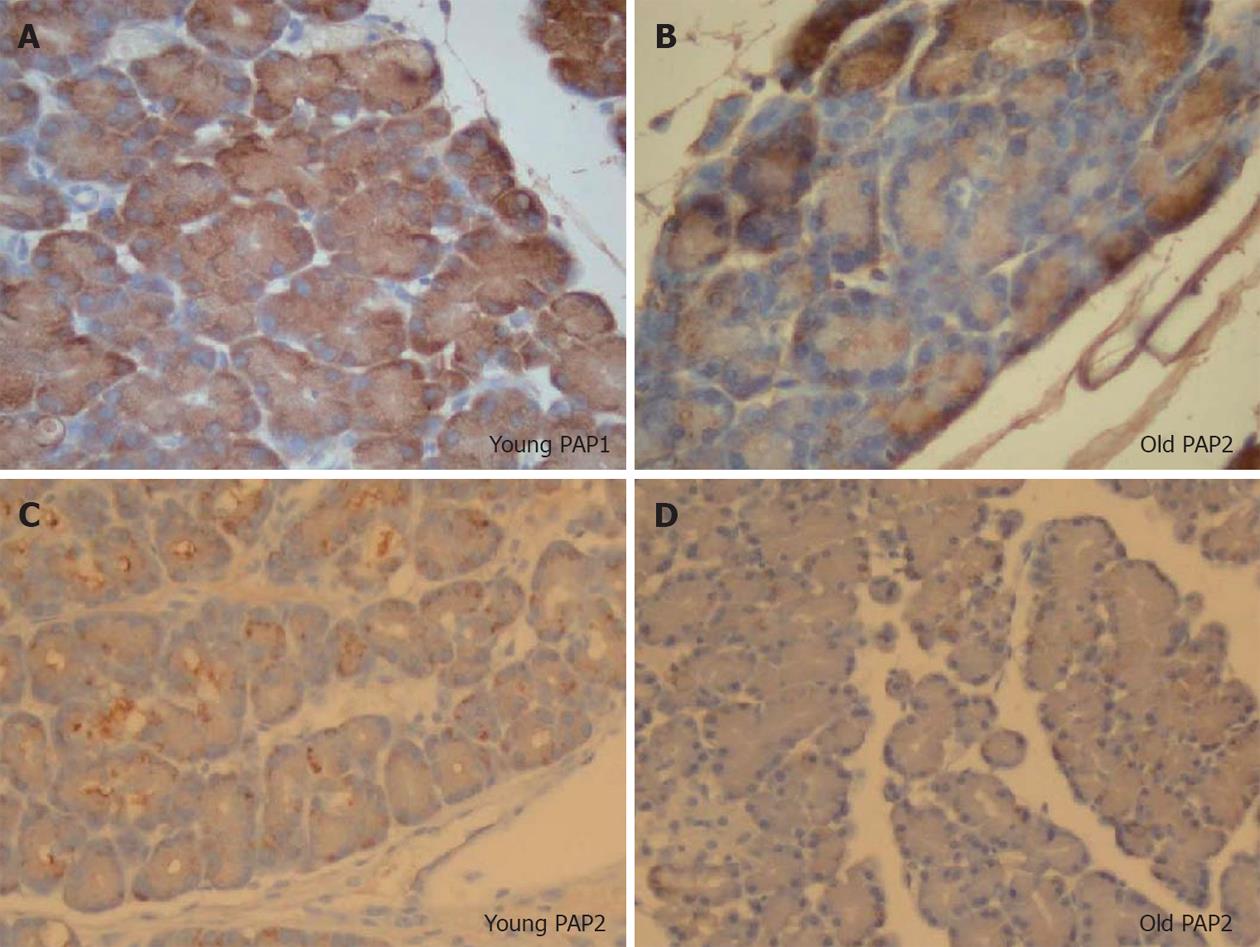
Figure 7 Immunohistochemical staining for pancreatitis-associated protein 1 and 2, high power (100×).
Young animals (A, C) are compared to older (B, D). A decreased intensity of staining is observed in aging, and while pancreatitis-associated protein (PAP)1 staining in younger animals is uniform, in older animals it is heterogenous. In contrast, while PAP2 staining patterns are heterogenous in younger animals, they are more uniform in older ones. Note the clumping of PAP2 within the cells of the younger animals, which is absent in the older group.
Figure 8 Association of pancreatitis-associated protein2 staining with inflammatory infiltrates.
A: Immunohistochemical staining in animals 24 h after sodium taurocholate. The arrow points to intense stromal infiltration near the periphery of intense pancreatitis-associated protein (PAP2) staining (40×); B: Association of PAP2 positive cells with stromal leukocyte infiltration depicted by arrow in A (100×); C: Association of PAP2 positive cells with parenchymal leukocyte infiltration (100×). This association was not seen for PAP1 (not shown).
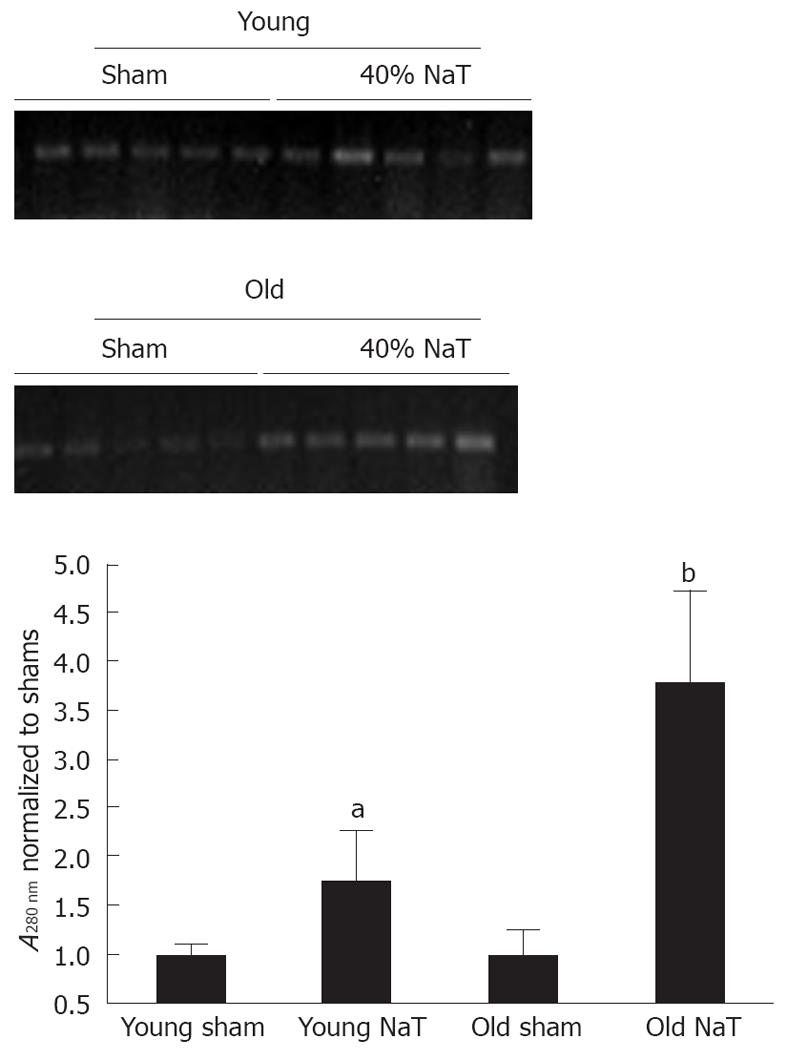
Figure 9 Molecular quantitation of bacterial levels in pancreatic tissue in unoperated controls, sham-operated animals and 24 h after sodium taurocholate pancreatitis.
DNA from pancreas was subjected to semiquantitative polymerase chain reaction (PCR) using probes for the genomic sequences of bacterial ribosomal RNA. Top Panel shows representative polyacrylamide gels showing the 370 base pair PCR product; Bottom graph shows quantitated values from multiple experiments. No differences were seen between controls and sham-operated animals (not shown). There were significant differences in bacterial genomic levels between sham and sodium taurocholate (NaT) animals (aP < 0.05), and between young and old (bP = 0.008) NaT animals, when percent increases were compared (Mann-Whitney U test).
- Citation: Fu S, Stanek A, Mueller CM, Brown NA, Huan C, Bluth MH, Zenilman ME. Acute pancreatitis in aging animals: Loss of pancreatitis-associated protein protection? World J Gastroenterol 2012; 18(26): 3379-3388
- URL: https://www.wjgnet.com/1007-9327/full/v18/i26/3379.htm
- DOI: https://dx.doi.org/10.3748/wjg.v18.i26.3379


