Copyright
©2012 Baishideng Publishing Group Co.
World J Gastroenterol. Jun 28, 2012; 18(24): 3089-3098
Published online Jun 28, 2012. doi: 10.3748/wjg.v18.i24.3089
Published online Jun 28, 2012. doi: 10.3748/wjg.v18.i24.3089
Figure 1 Circulating T-helper 1 and T-helper 2 frequencies increased on d2 vs d0, and then recovered on d7, while T-helper 17 and regulatory T cell frequencies showed no difference on d2 vs d0, but decreased on d7.
A and B: FACS pictures showing T-helper (Th)1/Th2/Th17/Treg frequencies from a representative patient (d0 vs d2, bP < 0.01 for both) (Th1: d0 vs d7, bP < 0.01; d2 vs d7, aP < 0.05; Th2: d2 vs d7, bP < 0.01) (Th17: d2 vs d7, bP < 0.01; Treg: d2 vs d7, aP < 0.05); C: Statistical analyses of results from flow cytometry (n = 61).
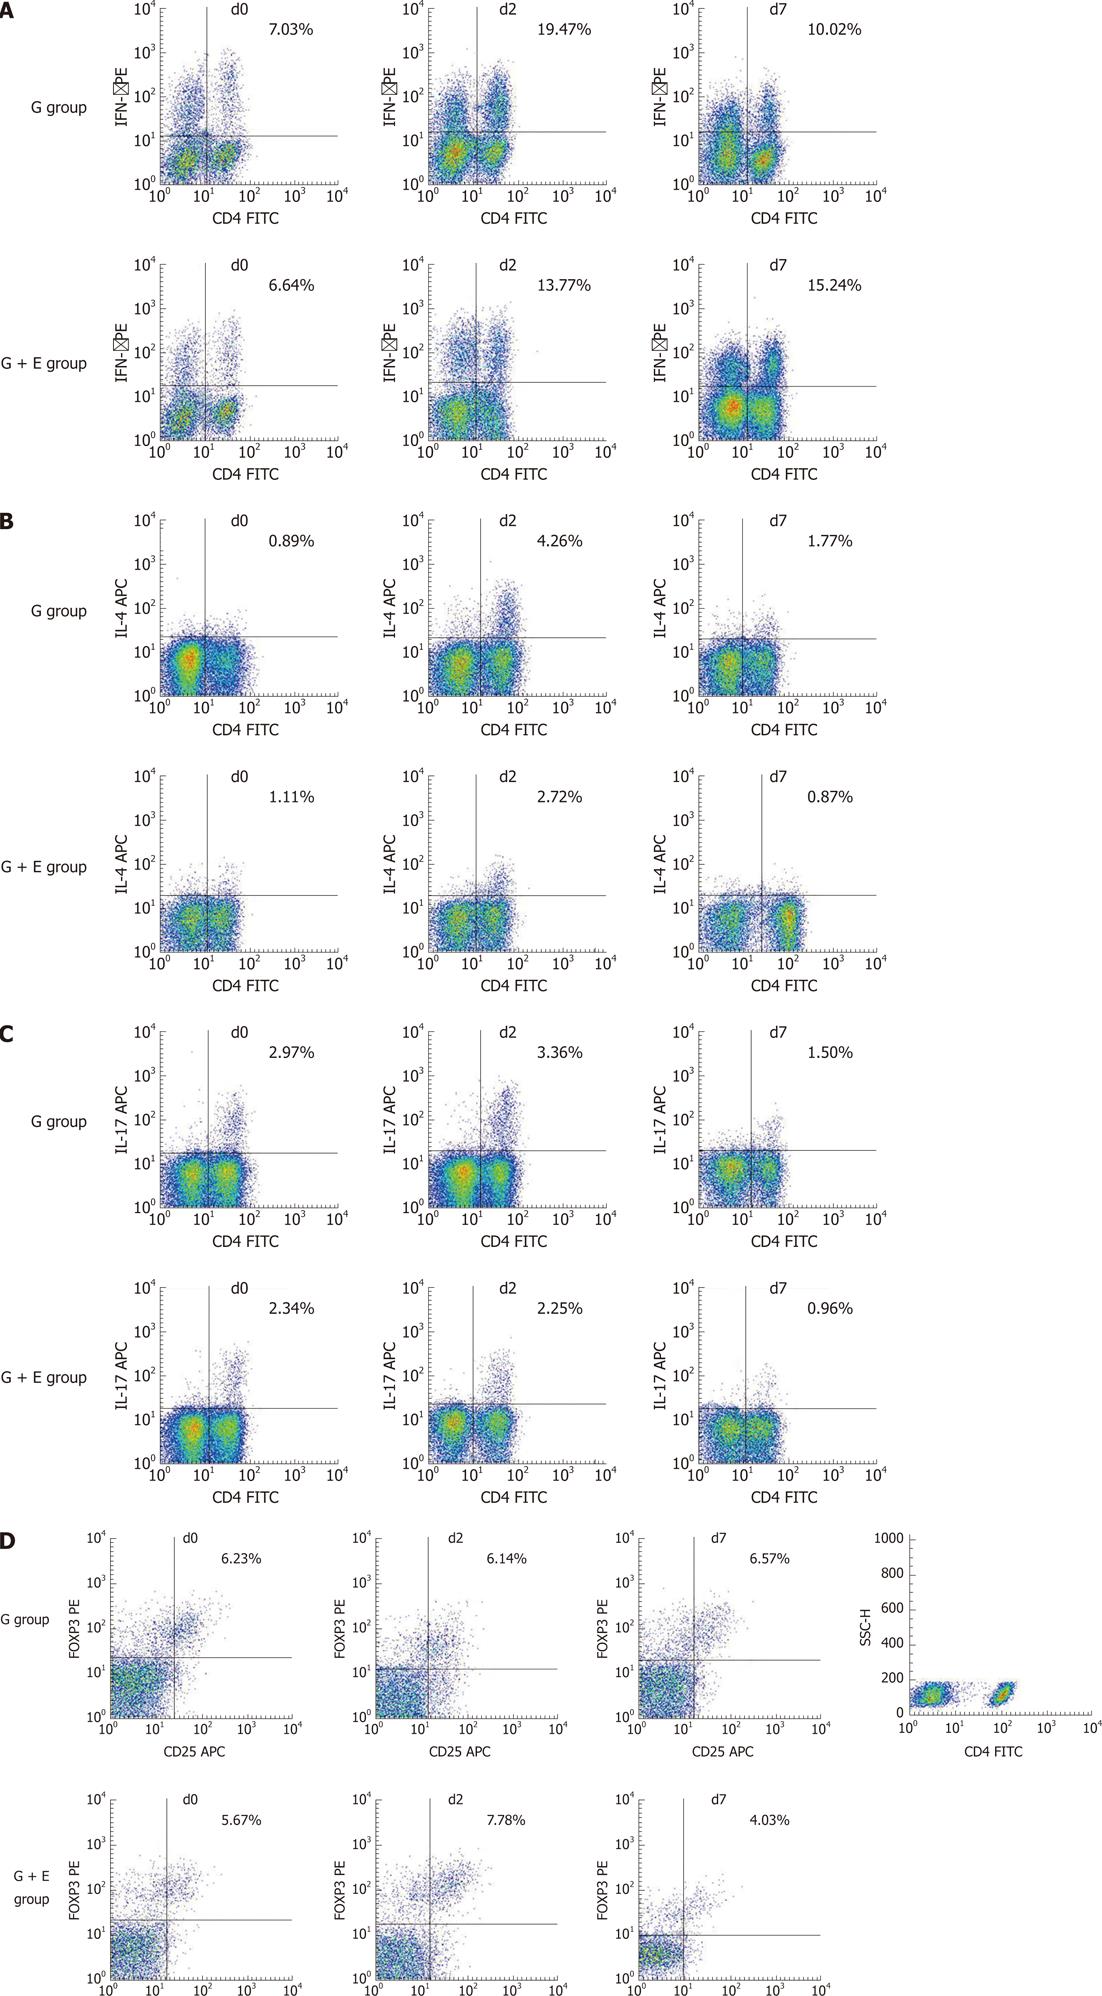
Figure 2 Representative FACS pictures of T-helper-cell subsets in the G + E and G group.
A: Circulating T-helper (Th) 1 frequencies were higher in the G + E group than those in the G group on d7; B: Th2 frequencies were lower in the G + E group than those in the G group on d2; C and D: Th17 and Treg frequencies were lower in the G + E group than those in the G group on d7. G: General anesthesia; E: Epidural block.
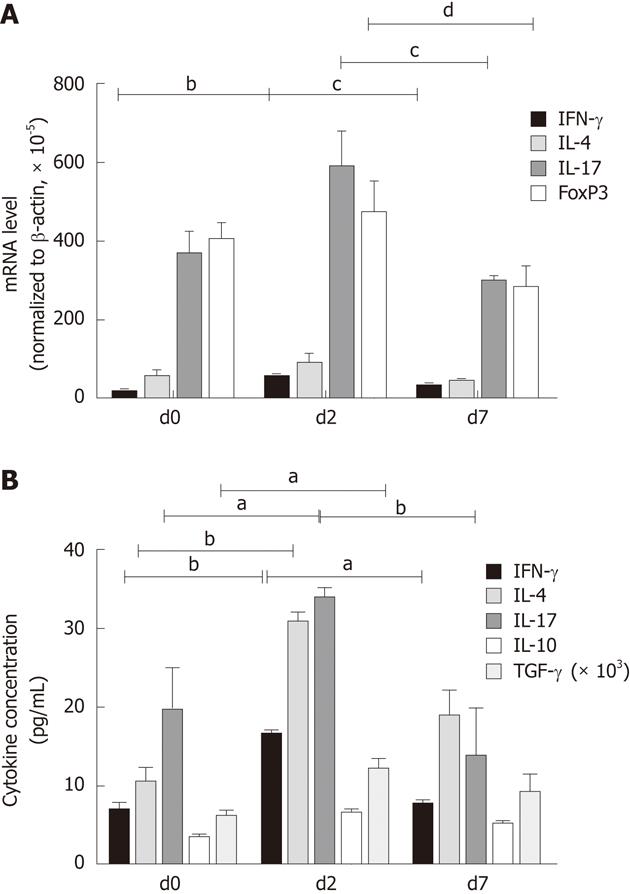
Figure 3 Statistics of T-helper-cell contents as measured by mRNA expression and cytokine levels.
A: mRNA expression of interferon (IFN)-γ, interleukin (IL)-4, IL-17 and FoxP3 on d0, d2 and d7; The mRNA expression levels of IFN-γ on d2 were increased compared to that on d0 (d0 vs d2, bP < 0.01), then partly recovered on d7 (d2 vs d7, cP <0.05). IL-4, IL-17 and FOXP3 mRNA expression levels showed no significant differences from d0 to d2, whereas mRNA levels of IL-17 and FOXP3 clearly decreased from d2 to d7 (IL-17: d2 vs d7, cP < 0.05; Treg: d2 vs d7, dP < 0.01); B: Cytokine concentrations of IFN-γ, IL-4, IL-17, IL-10 and transforming growth factor (TGF)-β1 on d0, d2 and d7 (d0 vs d2: aP < 0.05, bP < 0.01, respectively).
- Citation: Zhou D, Gu FM, Gao Q, Li QL, Zhou J, Miao CH. Effects of anesthetic methods on preserving anti-tumor T-helper polarization following hepatectomy. World J Gastroenterol 2012; 18(24): 3089-3098
- URL: https://www.wjgnet.com/1007-9327/full/v18/i24/3089.htm
- DOI: https://dx.doi.org/10.3748/wjg.v18.i24.3089


