Copyright
©2012 Baishideng Publishing Group Co.
World J Gastroenterol. Jun 28, 2012; 18(24): 3058-3069
Published online Jun 28, 2012. doi: 10.3748/wjg.v18.i24.3058
Published online Jun 28, 2012. doi: 10.3748/wjg.v18.i24.3058
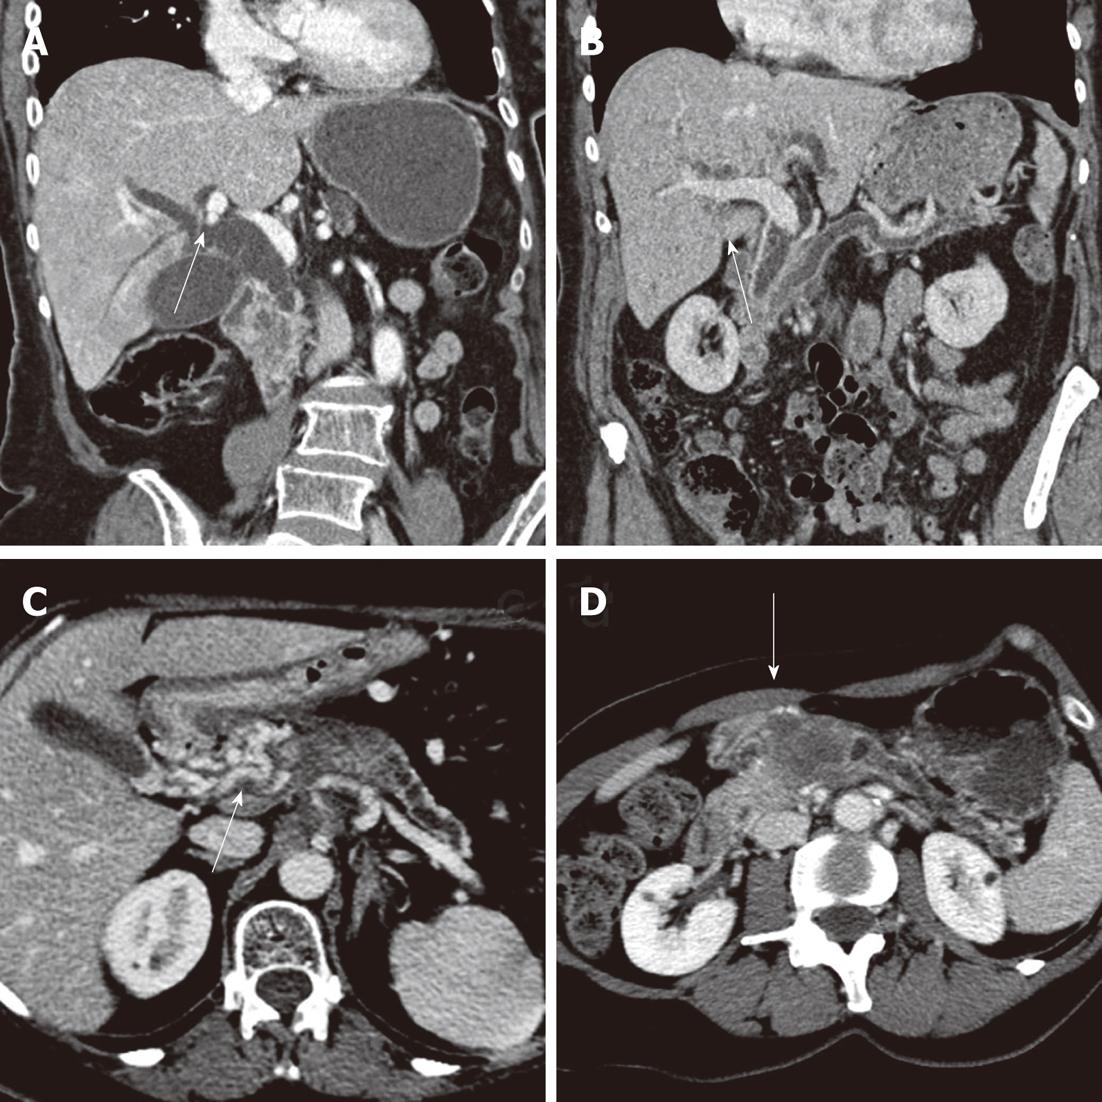
Figure 1 Ductal dilation, computer tomography 3-phase contrast-enhanced thin-slice helical scan.
A: Heterogenous tumor of the pancreatic head with consecutive extra- and intrahepatic bile duct dilatation (arrow); B: “Double duct sign” due to a tumor of the papilla of vater (arrow); C: Tumor of the pancreatic neck with an upstream dilatation of the pancreatic duct and parenchymal atrophy of the pancreatic gland. Presence of a cavernoma due to tumor thrombosis of the portal vein (arrow); D: Classic radiological presentation of a pancreatic neck tumor with a less pronounced enhancement compared to the normal pancreatic parenchyma (arrow).
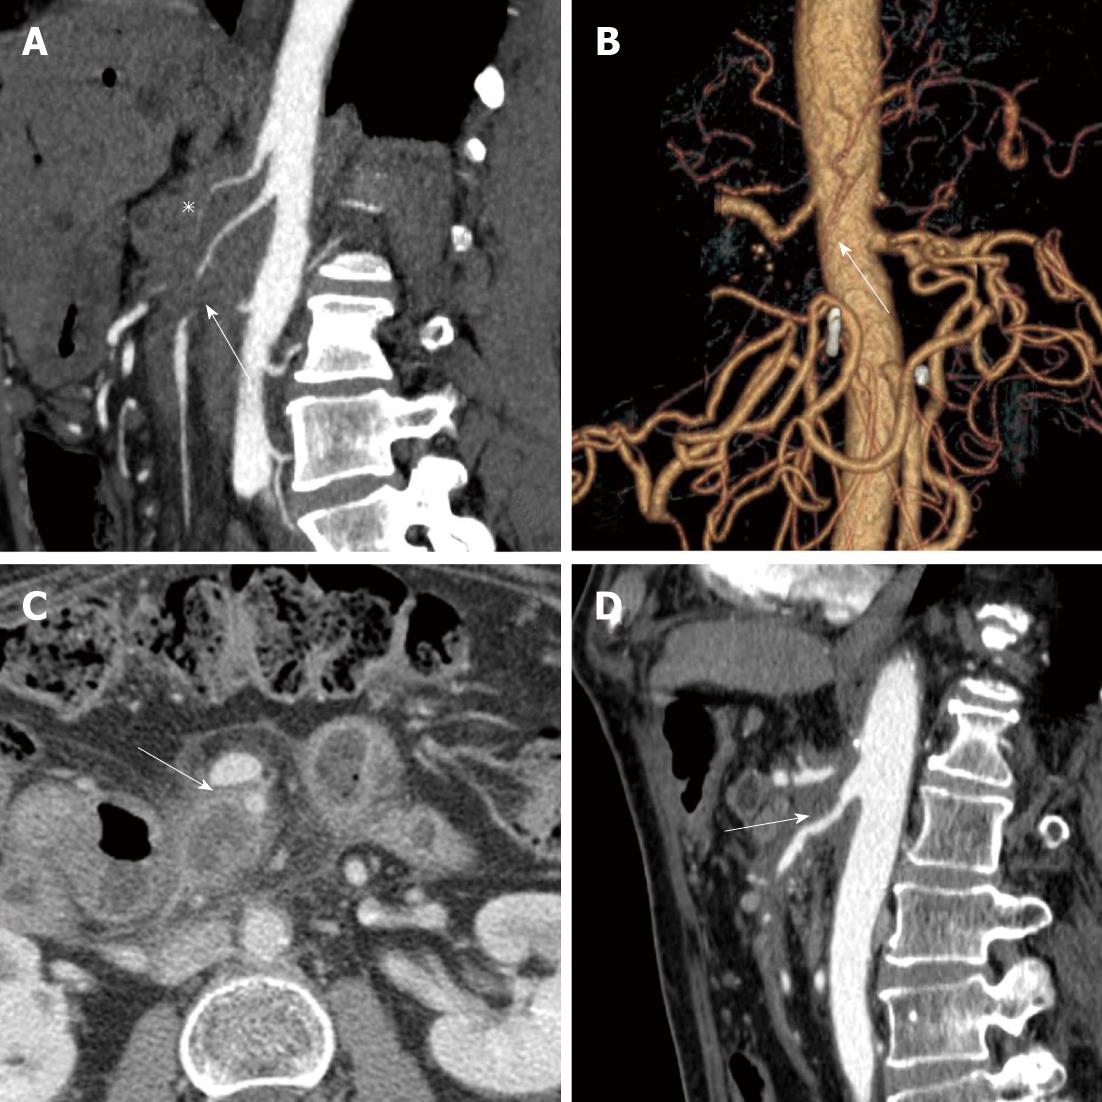
Figure 2 Vascular tumor extension, computer tomography 3-phase contrast-enhanced thin-slice helical scan, sagittal section and 3D reconstruction.
A, B: Sheathing and thrombosis of the celiac trunk (asterisk) and superior mesenteric artery (arrow) with collateral blood flow via the inferior mesenteric vessels; C: Tumor of the pancreas (arrow) in contact with the superior mesenteric artery and infiltration of the portal vein; D: Tumor sheathing or the origin of the superior mesenteric artery (arrow) with irregularities as a sign of arterial invasion.
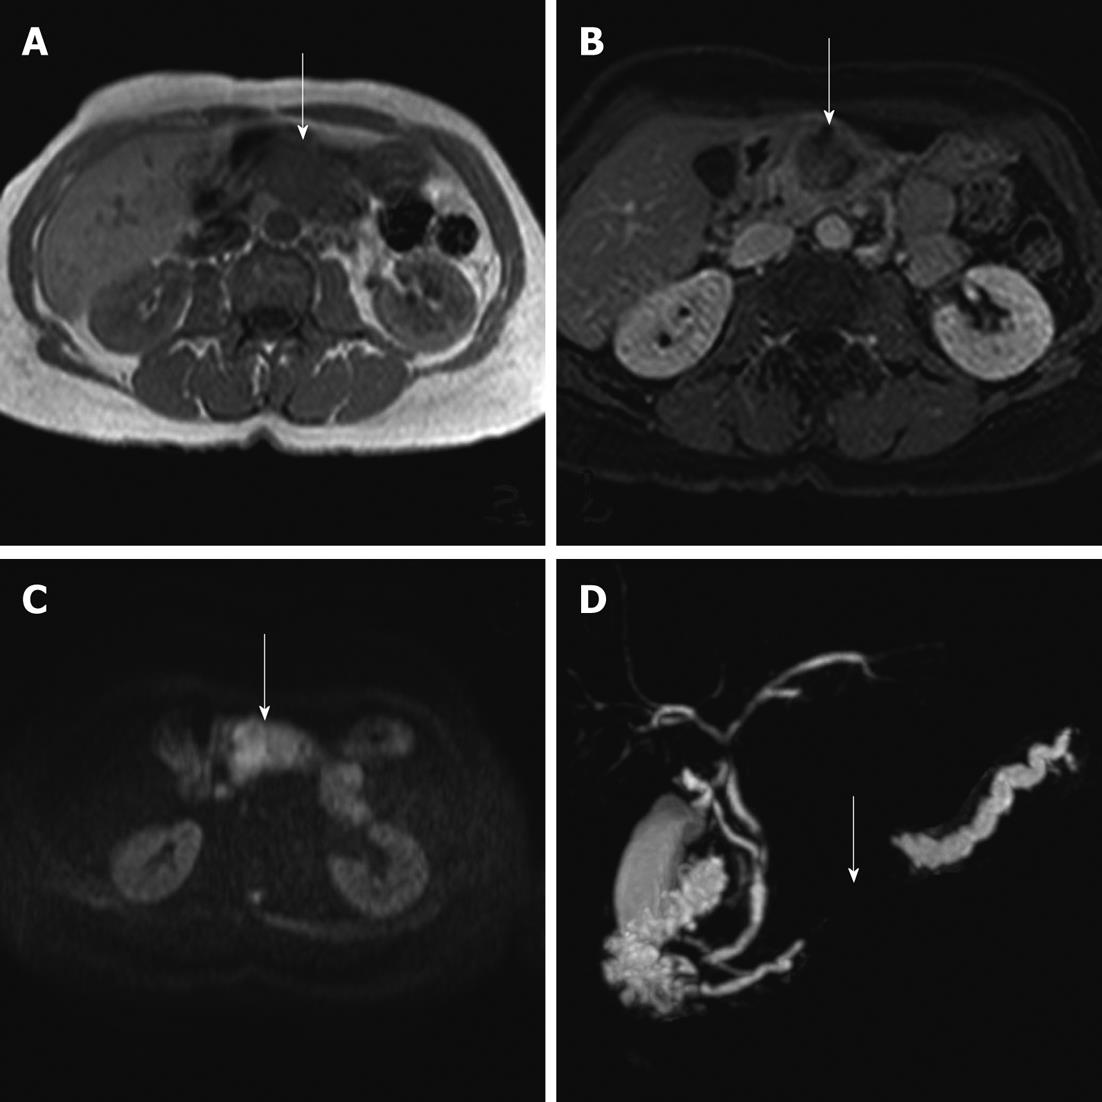
Figure 3 Magnetic resonance imaging appearance.
A: T1 sequence showing an adenocarcinoma of the pancreas with a hypo-intense signal (arrow), whereas normal pancreatic tissue appears hyper-intense; B: T1 sequence with fat saturation injection: after injection of gadolinium, the pancreatic adenocarcinoma is hypo-enhanced (arrow) compared to the healthy parenchyma; C: A sequence of diffusion: hyper-intensity (arrow) signal due to the hyper-cellularity of the tumor; D: Sequence 3D-magnetic resonance cholangiopancreatography: stenosis of the main pancreatic duct (arrow) with upstream dilatation due to a tumor of the pancreatic isthmus.
- Citation: Ouaïssi M, Giger U, Louis G, Sielezneff I, Farges O, Sastre B. Ductal adenocarcinoma of the pancreatic head: A focus on current diagnostic and surgical concepts. World J Gastroenterol 2012; 18(24): 3058-3069
- URL: https://www.wjgnet.com/1007-9327/full/v18/i24/3058.htm
- DOI: https://dx.doi.org/10.3748/wjg.v18.i24.3058


