Copyright
©2012 Baishideng Publishing Group Co.
World J Gastroenterol. Jun 21, 2012; 18(23): 2938-2947
Published online Jun 21, 2012. doi: 10.3748/wjg.v18.i23.2938
Published online Jun 21, 2012. doi: 10.3748/wjg.v18.i23.2938
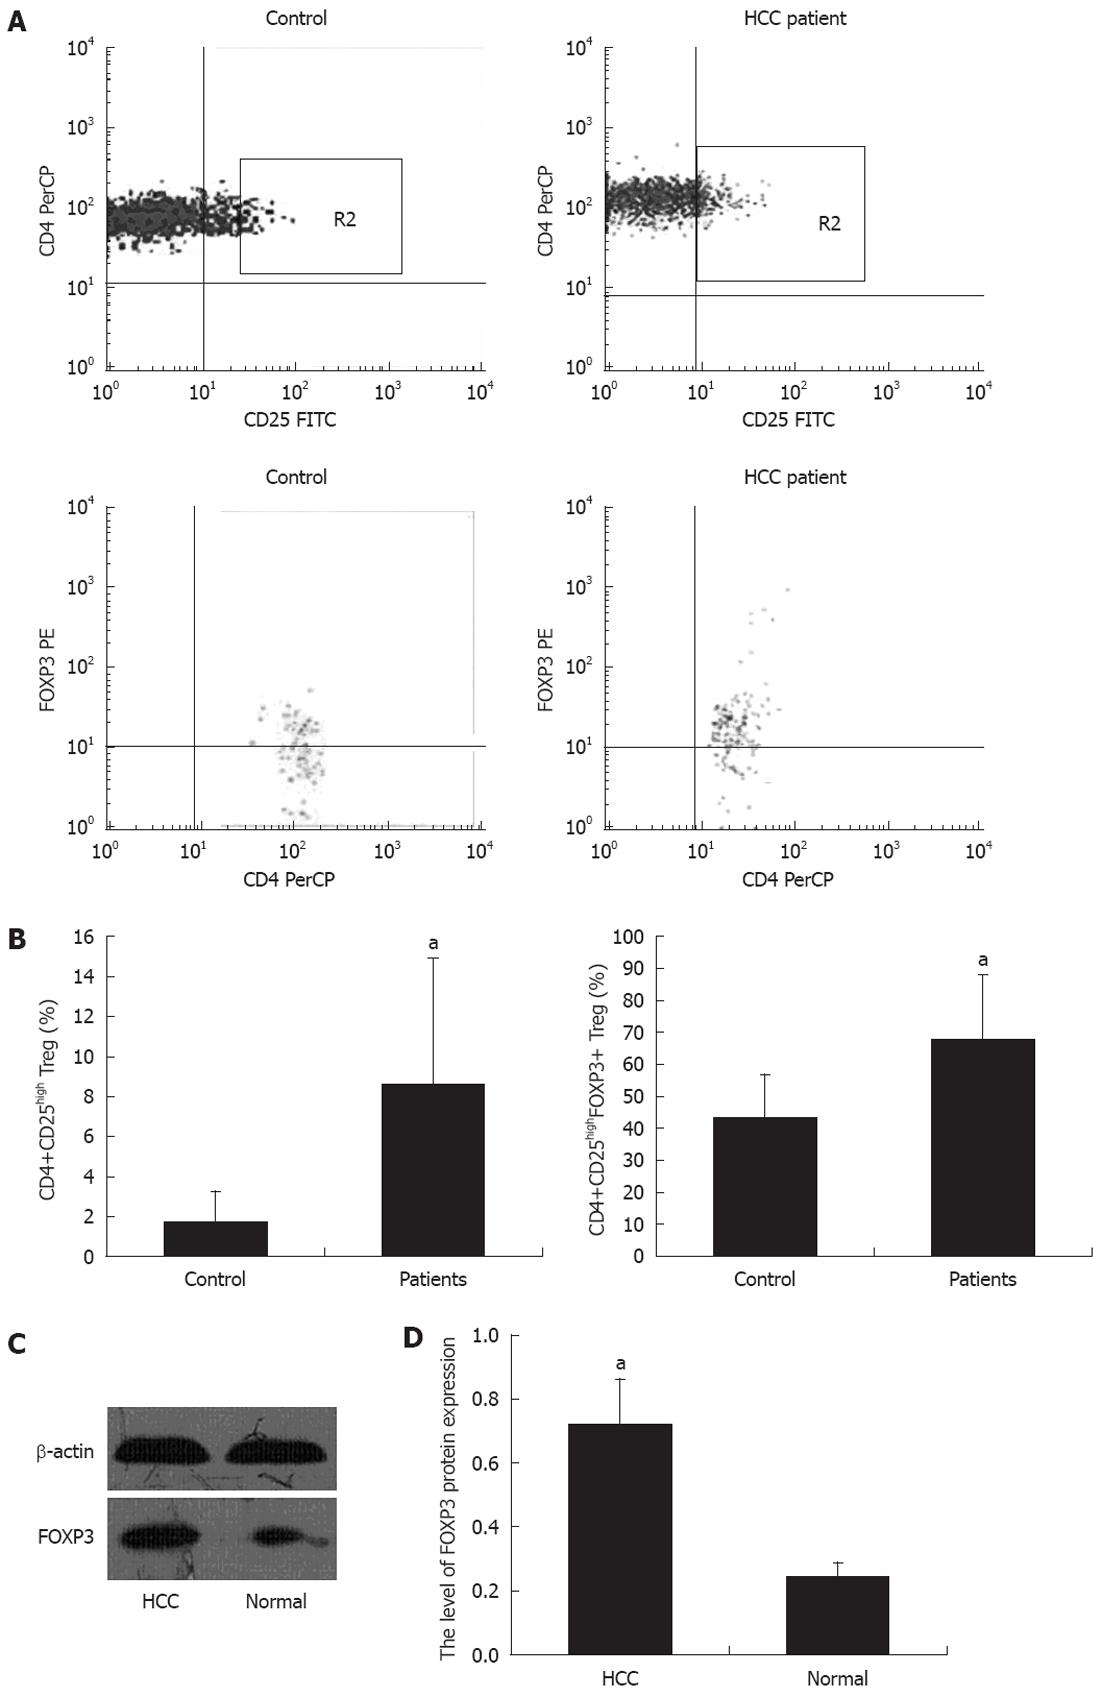
Figure 1 CD4+CD25highFOXP3+ regulatory T cells accumulation in hepatocellular carcinoma and peripheral blood.
A: Representative flow cytometry plots of CD4+CD25high regulatory T cell (Treg) (region R2) and family of transcription factor P3 (FOXP3)+ Treg cells in peripheral blood from a healthy donor and hepatocellular carcinoma (HCC) patient; B: Percentage of CD4+CD25high Treg and FOXP3+ Treg cells in peripheral blood from HCC patients and controls; C: The prevalence of CD4+CD25high Treg (8.57% ± 6.31%, P = 0.002) and FOXP3+ Treg cells (67.51% ± 20.59%, P < 0.05) in peripheral blood from HCC patients was significantly higher than that of healthy donors (1.71% ± 1.59% and 43.35% ± 13.91%, respectively). Western blotting analysis of nuclear extracts prepared from HCC and normal tissues; D: The relative expression of FOXP3 protein (FOXP3 protein/β-actin protein × 100%). The FOXP3 protein expression in HCC tissues was stronger (0.72 ± 0.14) as compared with normal tissues (0.24 ± 0.05) (aP < 0.05). FITC: Fluorescein isothiocyanate.
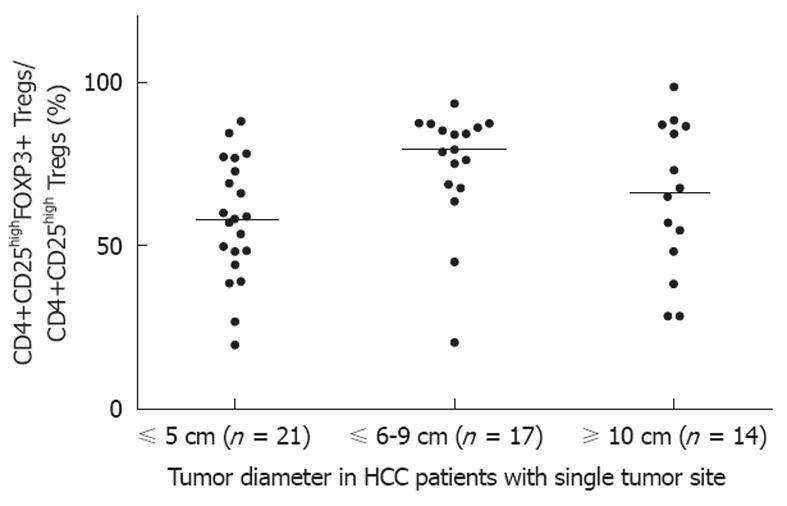
Figure 2 Correlation of regulatory T cells with tumor size of a single tumor.
Circulating levels of CD4+CD25highFOXP3+ regulatory T cells (Tregs) was low in patients with a small tumor (less than 5 cm in diameter). Comparisons of data of Tregs among 3 tumor size groups using a Kruskal-Wallis test. Statistically significant differences were found in all comparisons between the 3 groups (χ2: 7.365, P = 0.0252). HCC: Hepatocellular carcinoma.
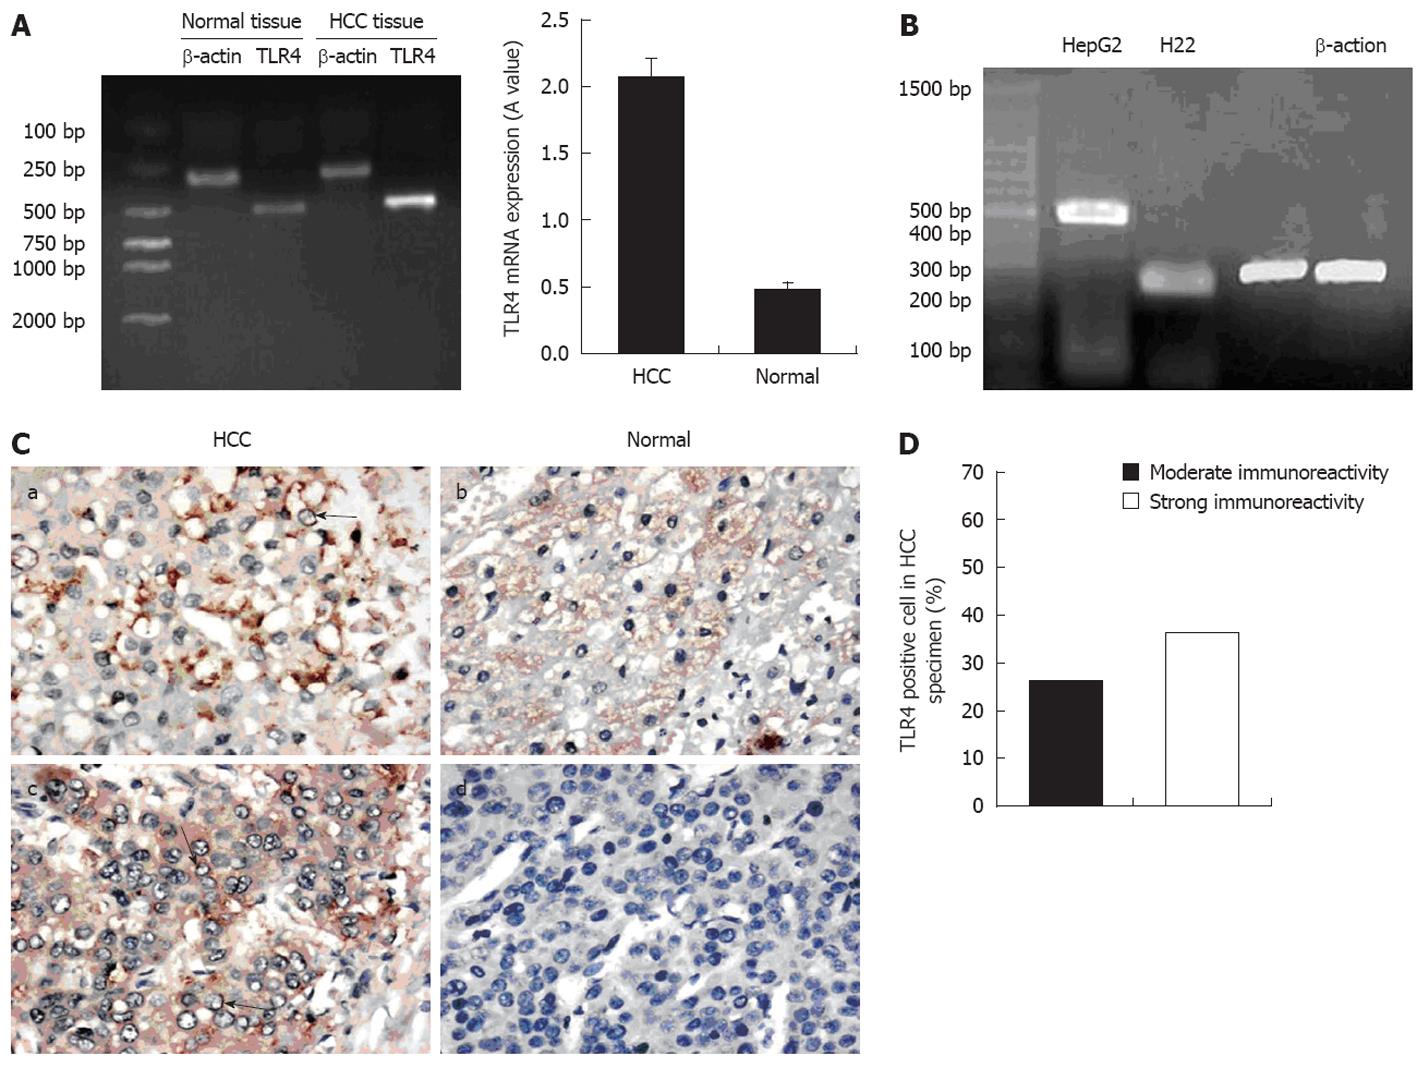
Figure 3 Expression of toll-like receptor 4 mRNA in hepatocellular carcinoma patients and hepatoma cell lines.
A: Reverse transcriptase polymerase chain reaction analysis of total RNA from hepatocellular carcinoma (HCC) and normal tissues. The toll-like receptor 4 (TLR4) mRNA expression in HCC tissues was stronger (2.08 ± 0.14) compared to normal tissues (0.48 ± 0.05) (P = 0.01); B: TLR4 mRNA expressed in human HepG2 and murine H22 hepatoma cell lines; C: Expression of TLR4 protein in HCC and normal tissues by immunohistochemistry. a, c: Paraffin-embedded sections of HCC exhibiting positive expression on the membrane and in the cytoplasm in several positive hepatocytes (arrows) [diaminobenzidine (DAB) ×400]; b, d: Paraffin-embedded sections of normal tissues showing weaker expression (DAB ×400); D: TLR4 was detected by immunohistochemistry in tissue sections of patients with HCC (frequency of positive hepatocytes for TLR4 in paraffin-embedded sections).
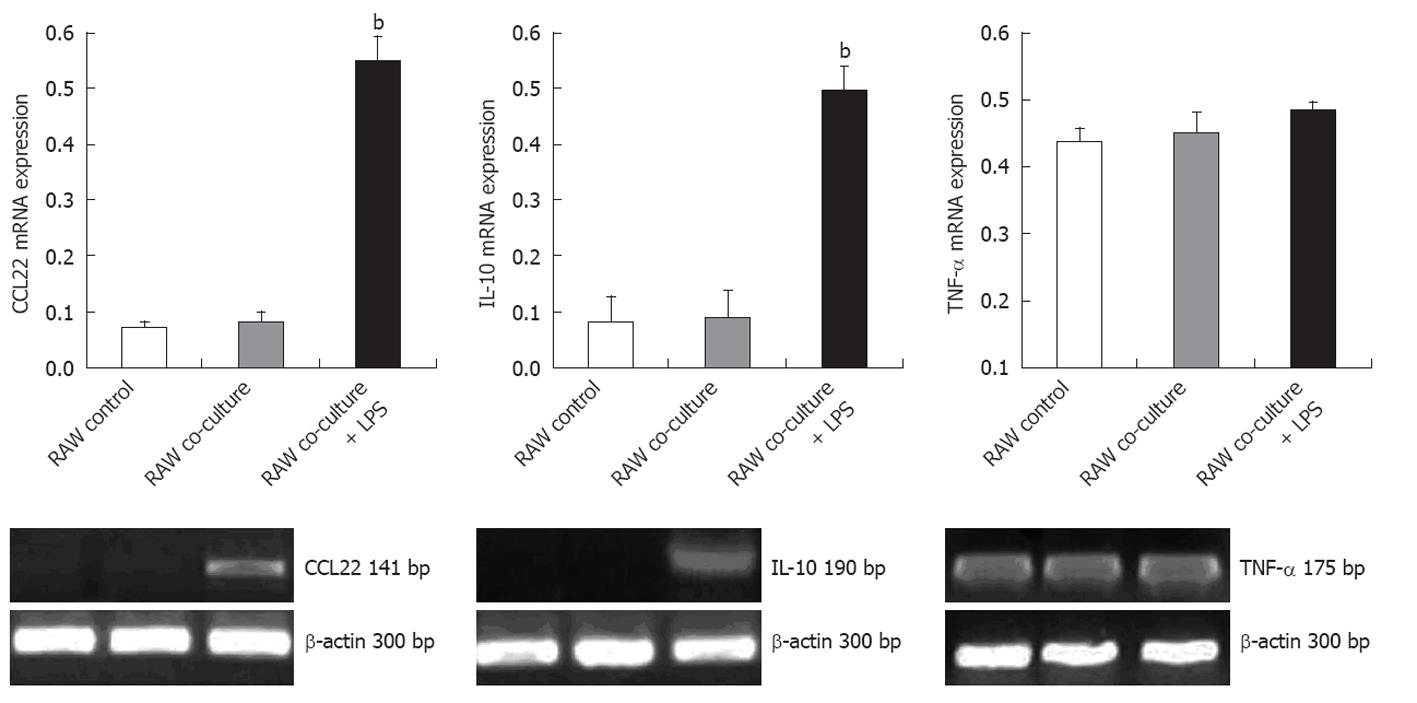
Figure 4 Tumor necrosis factor-α, interleukin-10, and CCL22 mRNA expression in RAW246.
7 and RAW246.7 cells co-cultured with H22 cells ± lipopolysaccharide. The bars indicate the relative amount of tumor necrosis factor (TNF)-α, interleukin (IL)-10 and CCL22 mRNA expression (reverse transcriptase polymerase chain reaction). LPS: Lipopolysaccharide. bP < 0.001 vs RAW co-culture.
Figure 5 Correlation between the expression of toll-like receptor 4 in hepatocellular carcinoma specimens, tumor Union for International Cancer Control stage, and CD4+CD25high FOXP3+ regulatory T cell.
A: Toll-like receptor 4 expression was positively correlated with the number of CD4+CD25highFOXP3+ regulatory T cells (Tregs) in peripheral blood. Analysis of data was performed using Spearman’s rank correlation coefficients (n = 60, r = 0.411, P < 0.001); B: According to Union for International Cancer Control/tumor-node-metastasis classification, there were 19 cases, 24 cases, and 17 cases at stage I, II and III hepatocellular carcinoma, respectively. Statistically negative correlations were found in all comparisons between the 3 groups (χ2 = 0.921, P = 0.631) using the Kruskal-Wallis test.
-
Citation: Yang J, Zhang JX, Wang H, Wang GL, Hu QG, Zheng QC. Hepatocellular carcinoma and macrophage interaction induced tumor immunosuppression
via Treg requires TLR4 signaling. World J Gastroenterol 2012; 18(23): 2938-2947 - URL: https://www.wjgnet.com/1007-9327/full/v18/i23/2938.htm
- DOI: https://dx.doi.org/10.3748/wjg.v18.i23.2938


