Copyright
©2012 Baishideng Publishing Group Co.
World J Gastroenterol. Jun 7, 2012; 18(21): 2712-2718
Published online Jun 7, 2012. doi: 10.3748/wjg.v18.i21.2712
Published online Jun 7, 2012. doi: 10.3748/wjg.v18.i21.2712
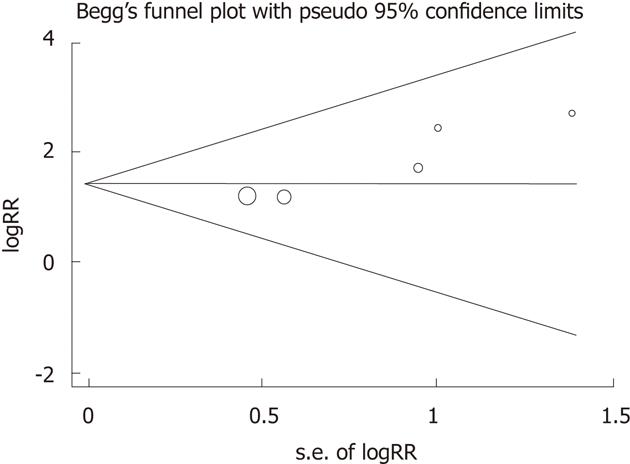
Figure 1 Begg’s funnel plot of publication bias.
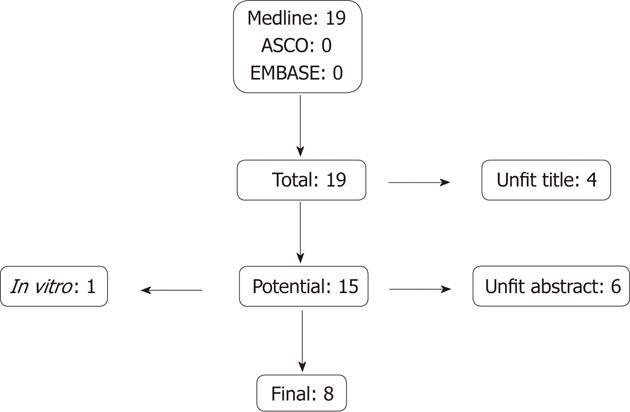
Figure 2 Selection of the studies.
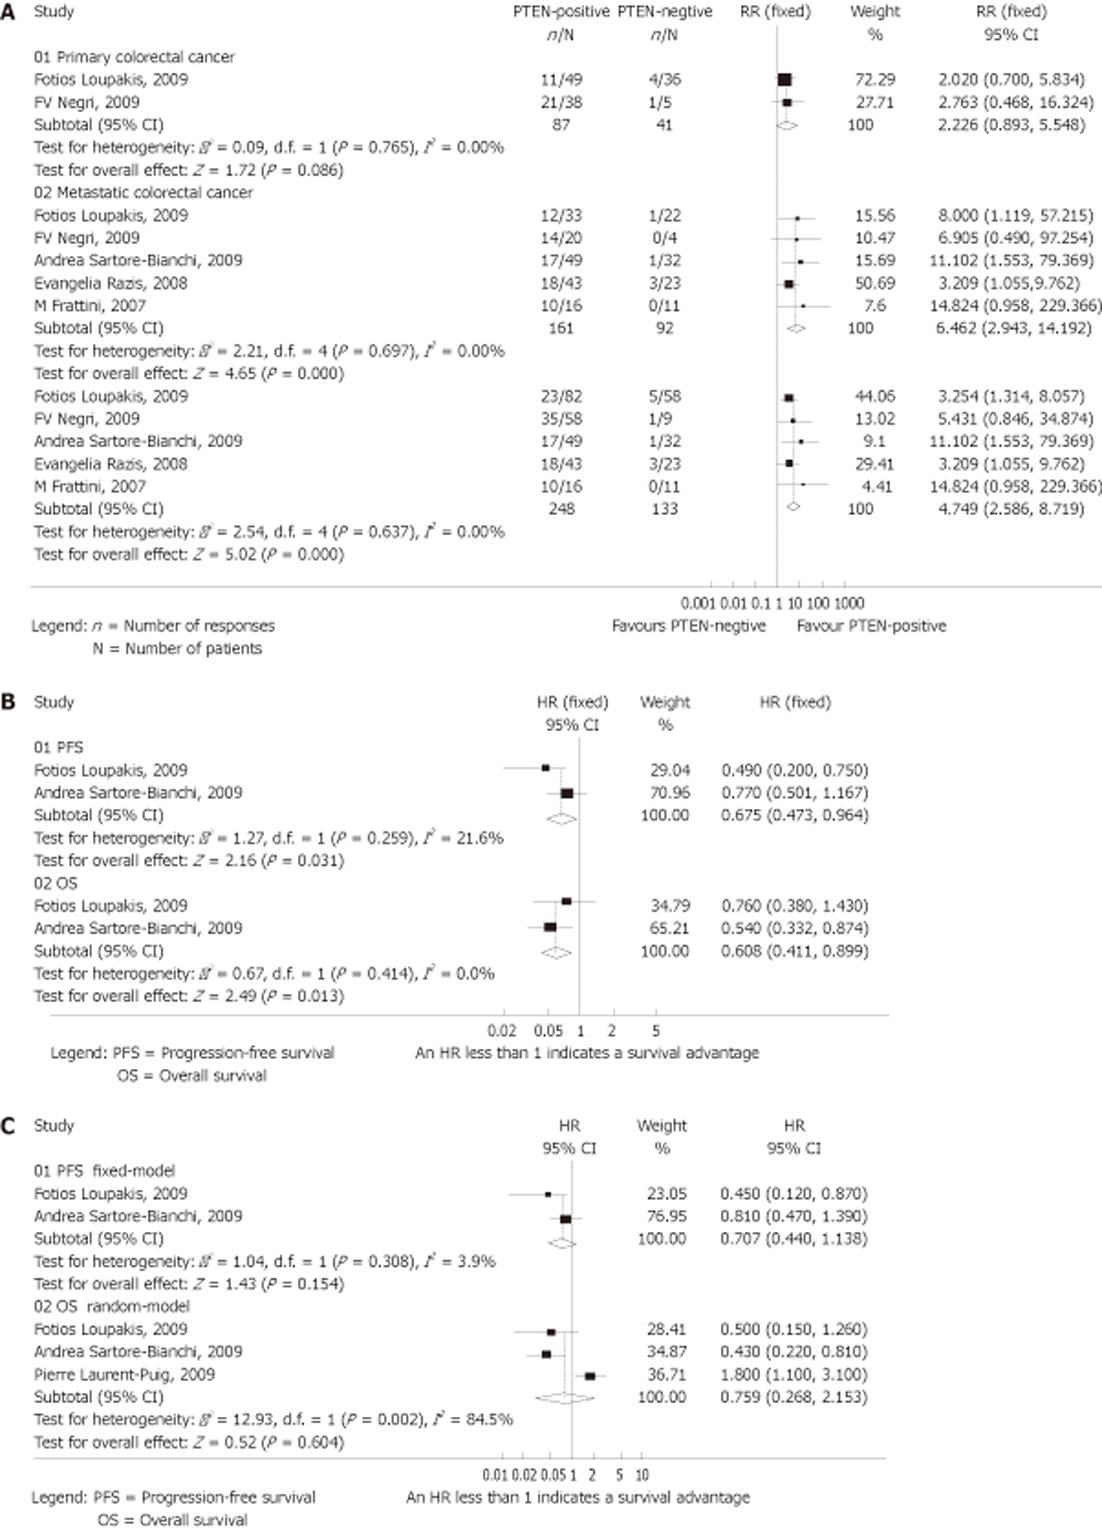
Figure 3 Analysis of status of the phosphatase and tensin homolog homolog.
A: Analysis of status of the phosphatase and tensin homolog (PTEN) homolog and objective response; B: Analysis of status of the PTEN homolog and survival; C: Combined analysis of the PTEN homolog and Kirsten rat sarcoma 2 viral oncogene homolog (KRAS) status and survival. RR: Risk ratio; CI: Confidence interval; HR: Hazard ratio; OS: Overall survival; PFS: Progression-free survival.
- Citation: Shen Y, Yang J, Xu Z, Gu DY, Chen JF. Phosphatase and tensin homolog expression related to cetuximab effects in colorectal cancer patients: A meta-analysis. World J Gastroenterol 2012; 18(21): 2712-2718
- URL: https://www.wjgnet.com/1007-9327/full/v18/i21/2712.htm
- DOI: https://dx.doi.org/10.3748/wjg.v18.i21.2712


