Copyright
©2012 Baishideng Publishing Group Co.
World J Gastroenterol. Jun 7, 2012; 18(21): 2704-2711
Published online Jun 7, 2012. doi: 10.3748/wjg.v18.i21.2704
Published online Jun 7, 2012. doi: 10.3748/wjg.v18.i21.2704
Figure 1 Expression of gamma-aminobutyric acid A receptor θ subunit in different cell lines, in liver cancerous tissues (Ca) and adjacent tissues of liver cancers (N) by reverse transcription polymerase chain reaction.
GAPDH: Glyceraldehyde-3-phosphate dehydrogenase.
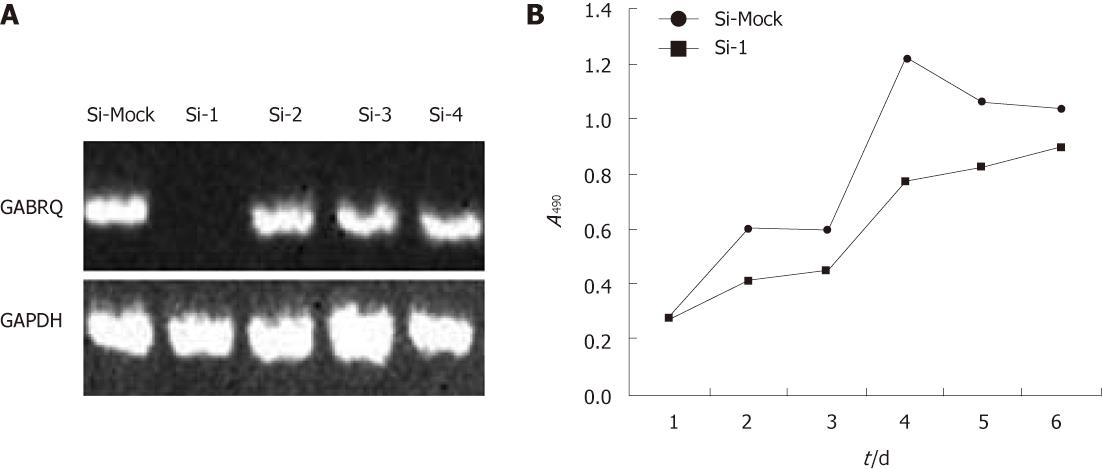
Figure 2 The impact of gamma-aminobutyric acid A receptor θ subunit-siRNA on the growth of hepatocellular carcinoma cells.
A: Reverse transcription polymerase chain reaction (RT-PCR) verified the RNAi effect on gamma-aminobutyric acid A receptor θ subunit (GABRQ); B: Methyl thiazolyl tetrazolium assay HepG2 cells transfected with Si-1 and negative vectors to GABRQ. GAPDH: Glyceraldehyde-3-phosphate dehydrogenase.
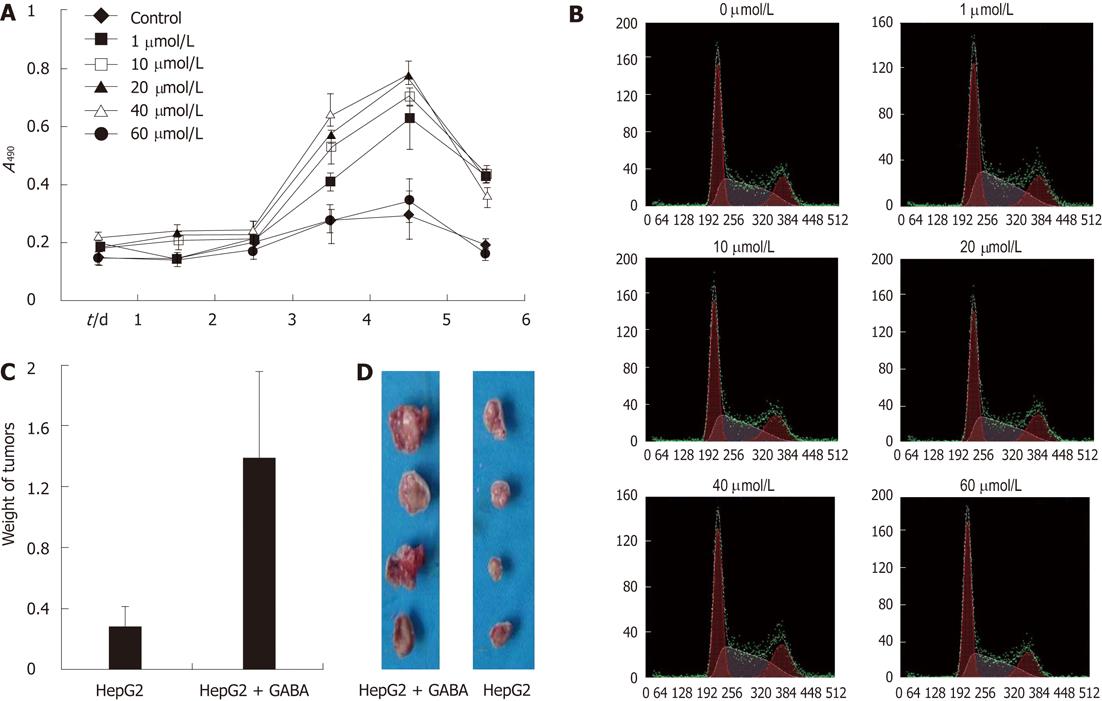
Figure 3 The effect of gamma-aminobutyric acid on the growth of hepatocellular carcinoma cells.
A: The effects of serial concentration gamma-aminobutyric acid (GABA) on proliferation of HepG-2 cells; B: Cell cycle measured by flow cytometry; C: Forty days after tumor cell injection, mice were sacrificed and tumor weight was recorded (n = 4, P < 0.01); D: Comparison of tumor weight (the left was tumor of mice injected with 0.9% NaCl only, the right was the tumor of mice treated with 40 μmoL/L GABA).
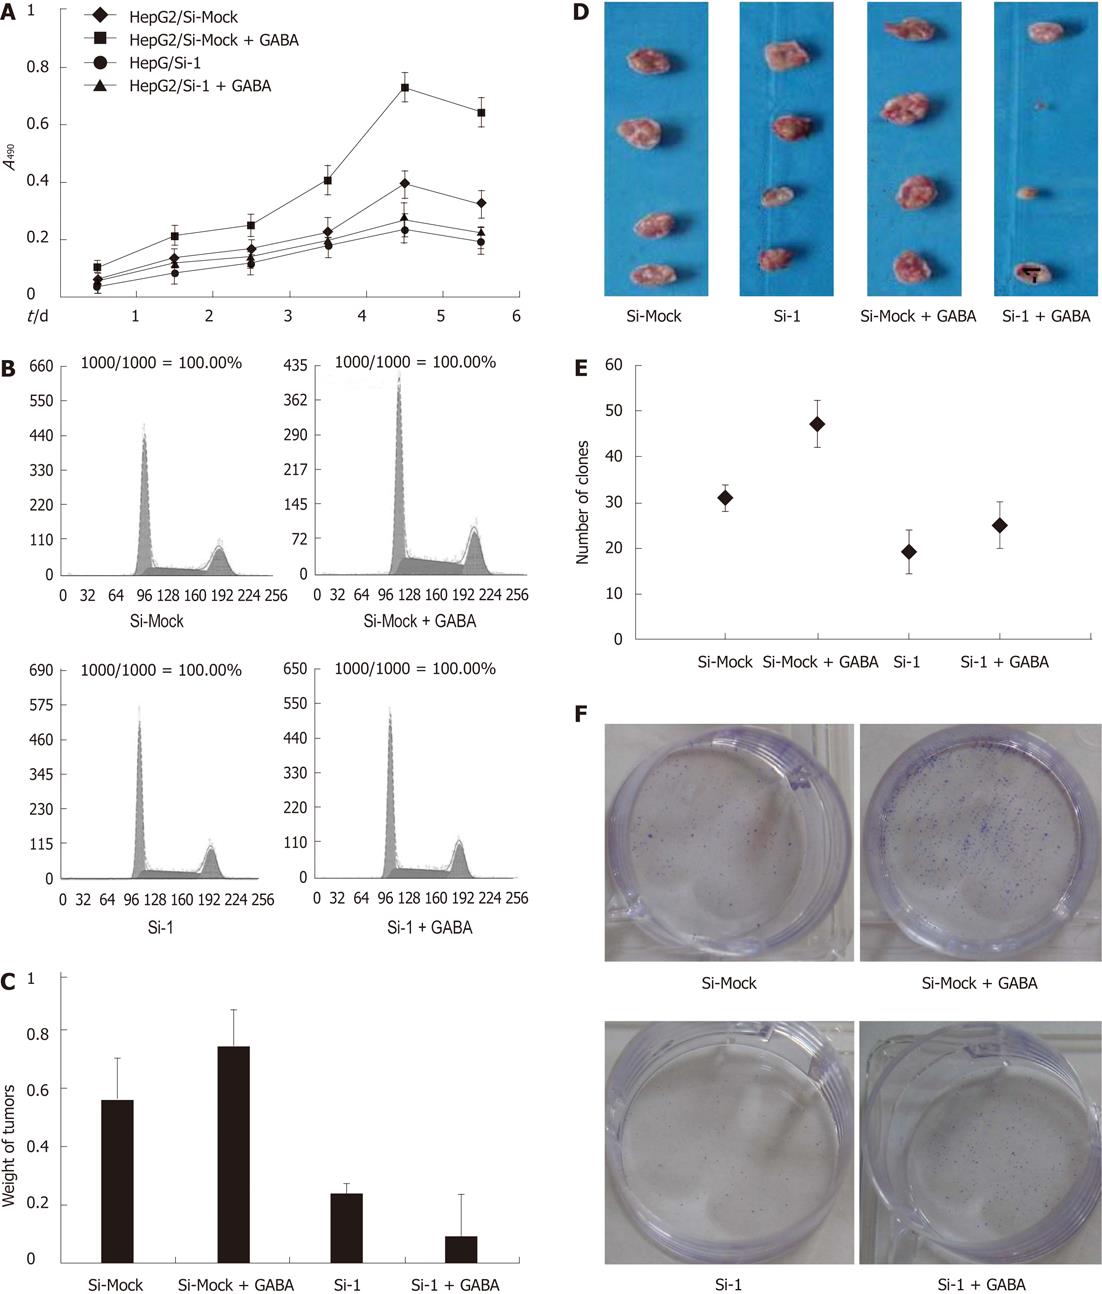
Figure 4 The effect of gamma-aminobutyric acid on the growth of hepatocellular carcinoma cells after down-regulated expression of gamma-aminobutyric acid A receptor θ subunit.
A: The effects of gamma-aminobutyric acid (GABA) on proliferation of HepG2/Si-Mock and HepG2/Si-1 cells; B: Analysis of cell cycles of HepG-2 cells by flow cytometry; C: Forty days after tumor cell injection, mice were sacrificed and tumor weight was recorded (n = 4, P < 0.01 for Si-Mock vs Si-Mock + GABA; n = 4, P < 0.01 for Si-1 vs Si-1 + GABA); D: Comparison of tumor weight (the left two ones were tumor of mice injected HepG2/Si-Mock and HepG2/Si-1 with 0.9% NaCl, the right two ones were the tumor of mice HepG2/Si-Mock and HepG2/Si-1 treated with 40 μmoL/L GABA); E and F: Colony formation assay (n = 3, P < 0.05 for HepG-2/Si-Mock vs HepG-2/Si-Mock + GABA).
- Citation: Li YH, Liu Y, Li YD, Liu YH, Li F, Ju Q, Xie PL, Li GC. GABA stimulates human hepatocellular carcinoma growth through overexpressed GABAA receptor theta subunit. World J Gastroenterol 2012; 18(21): 2704-2711
- URL: https://www.wjgnet.com/1007-9327/full/v18/i21/2704.htm
- DOI: https://dx.doi.org/10.3748/wjg.v18.i21.2704


