Copyright
©2012 Baishideng Publishing Group Co.
World J Gastroenterol. May 28, 2012; 18(20): 2493-2501
Published online May 28, 2012. doi: 10.3748/wjg.v18.i20.2493
Published online May 28, 2012. doi: 10.3748/wjg.v18.i20.2493
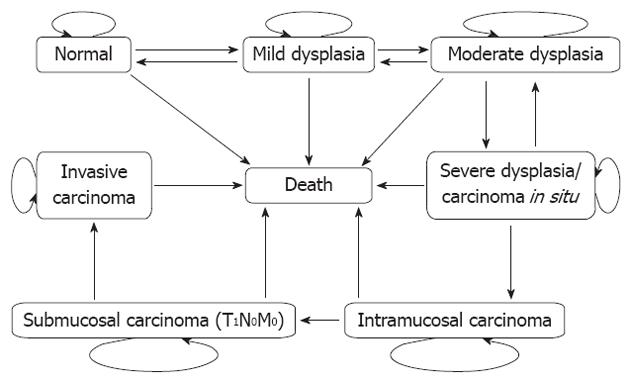
Figure 1 Bubble diagram representing the health states of esophageal cancer and transitions in natural-history Markov model.
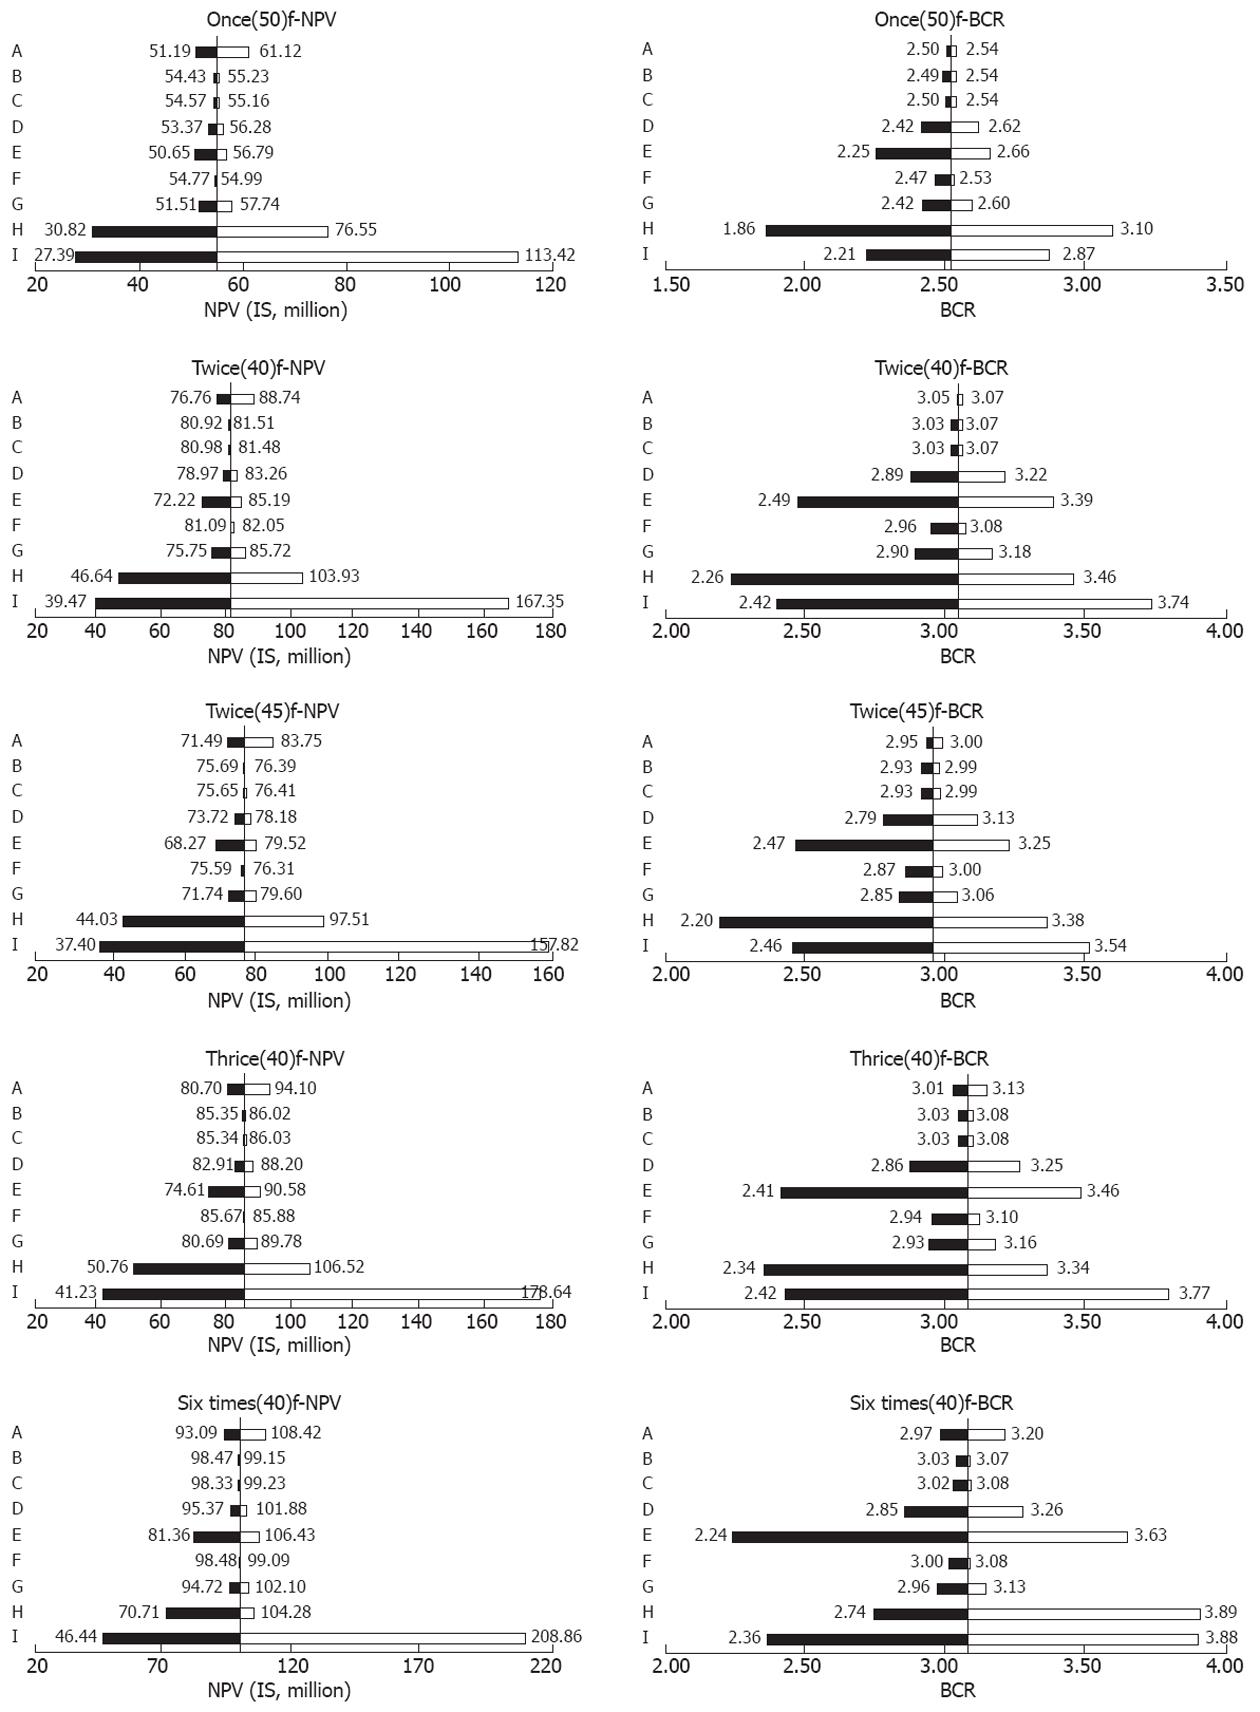
Figure 2 One-way sensitivity analyses for each cost-effective screening strategy.
Strategies are expressed as t(y)f: t denotes the frequencies of screening; y denotes the starting age of screening; f means the mild dysplasia and moderate dysplasia diagnosed by screening were followed up every five and three years. For twice and thrice screening strategies in the lifetime, the screening intervals were 10 years; for the six times screening strategy in the lifetime, the screening intervals were 5 years. A: Treatment costs for invasive carcinoma of “non-screening” group; B: Treatment costs for invasive carcinoma of screening group; C: Treatment costs for submucosal carcinoma (T1N0M0); D: Treatment costs for severe dysplasia/carcinoma in situ/intramucosal carcinoma; E: Screening costs; F: Specificity; G: Sensitivity; H: Screening compliance; I: Discount rate. Solid vertical lines represent the base cases of net present value (NPV)s/benefit-cost ratio (BCR)s. For B, C, D, E and I, the left of each bar, the lowest bound of NPVs/BCRs range, was counted on the basis of the maximum values of related parameters; and the right of each bar, the highest bound of NPVs/BCRs range, was counted according to the minimum values of related parameters. For other parameters, the left/right of each bar was calculated based on their minimum/maximum values.
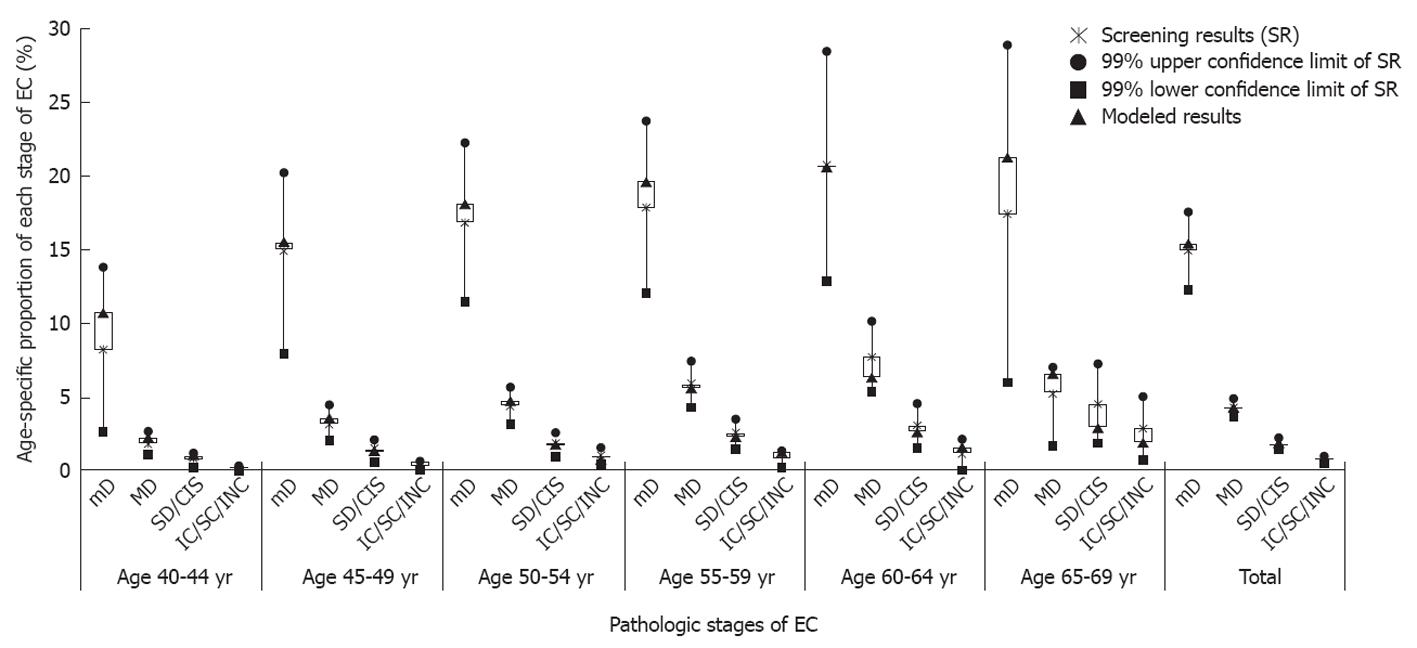
Figure 3 Comparison of modeled age-specific proportion of each pathologic stage of esophageal cancer with screening results.
EC: Esophageal cancer; mD: Mild dysplasia; MD: Moderate dysplasia; SD/CIS: Severe dysplasia/carcinoma in situ; IC: Intramucosal carcinoma; SC: Submucosal carcinoma (T1N0M0); INC: Invasive carcinoma.
- Citation: Yang J, Wei WQ, Niu J, Liu ZC, Yang CX, Qiao YL. Cost-benefit analysis of esophageal cancer endoscopic screening in high-risk areas of China. World J Gastroenterol 2012; 18(20): 2493-2501
- URL: https://www.wjgnet.com/1007-9327/full/v18/i20/2493.htm
- DOI: https://dx.doi.org/10.3748/wjg.v18.i20.2493


