Copyright
©2012 Baishideng Publishing Group Co.
World J Gastroenterol. Apr 21, 2012; 18(15): 1753-1764
Published online Apr 21, 2012. doi: 10.3748/wjg.v18.i15.1753
Published online Apr 21, 2012. doi: 10.3748/wjg.v18.i15.1753
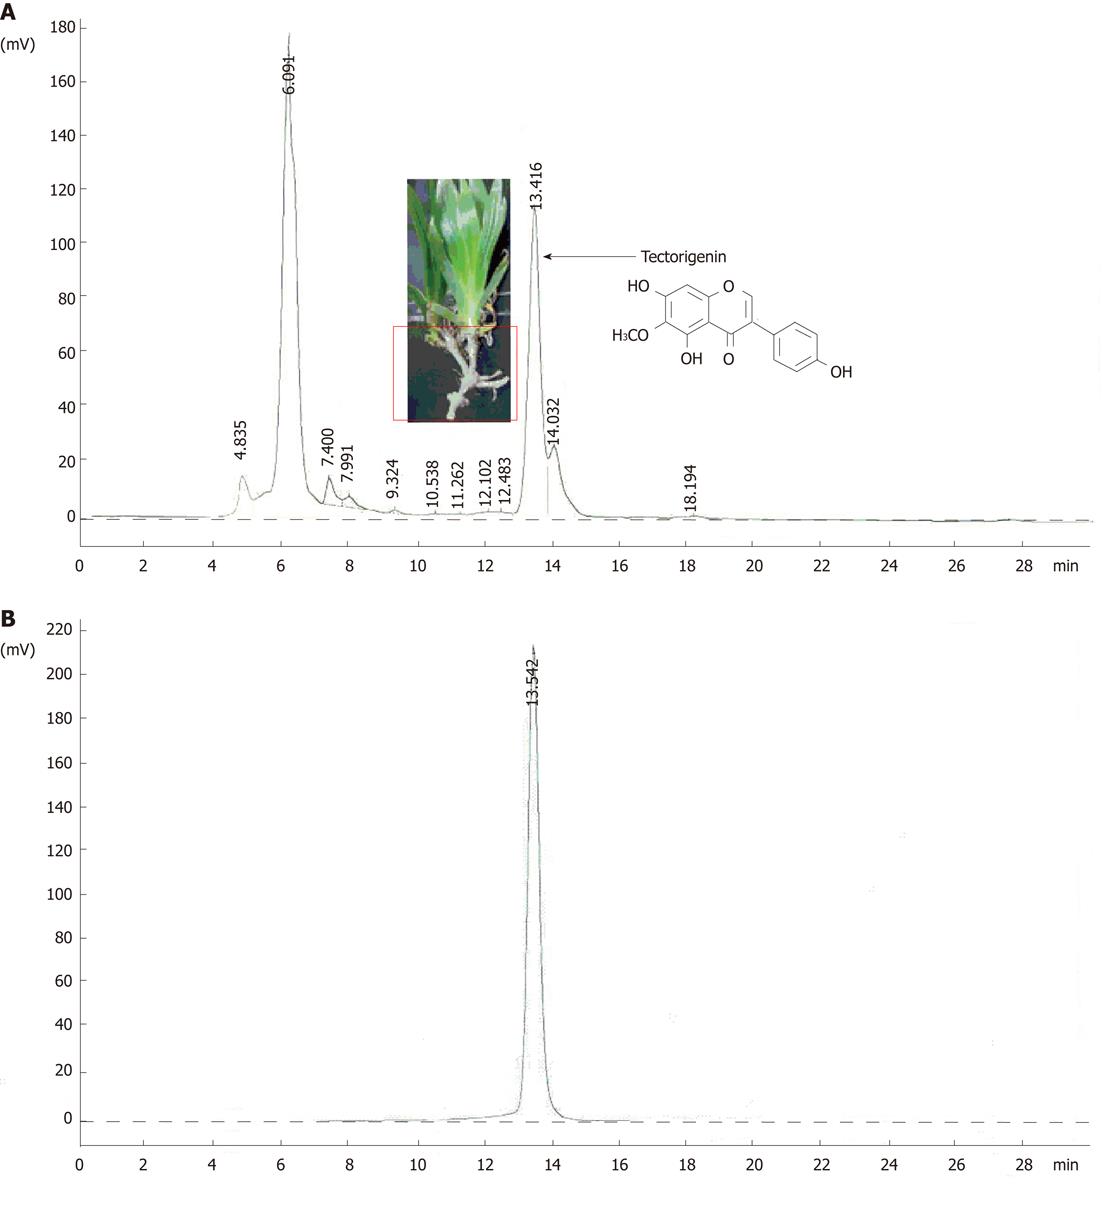
Figure 1 The high-performance liquid chromatography profiles of the aqueous ethanol (80%) extract of Iris tectorum rhizomes (A) and tectorigenin (B).
High-performance liquid chromatography analysis was accomplished at 25 °C on an instrument consisting of L-7110 (Hitachi) pump, L-7420 (Hitachi) ultraviolet detector (set at 254 nm) and Alltech Apollo C18 (4.6 mm × 250 mm) column using MeOH:EtOAc:H2O (60:1:40) mixture as a mobile phase at a flow rate of 1.0 mL/min. Sample injection: 10 μL of extract (2.5 g/L) or tectorigenin (100 mg/L) in MeOH.
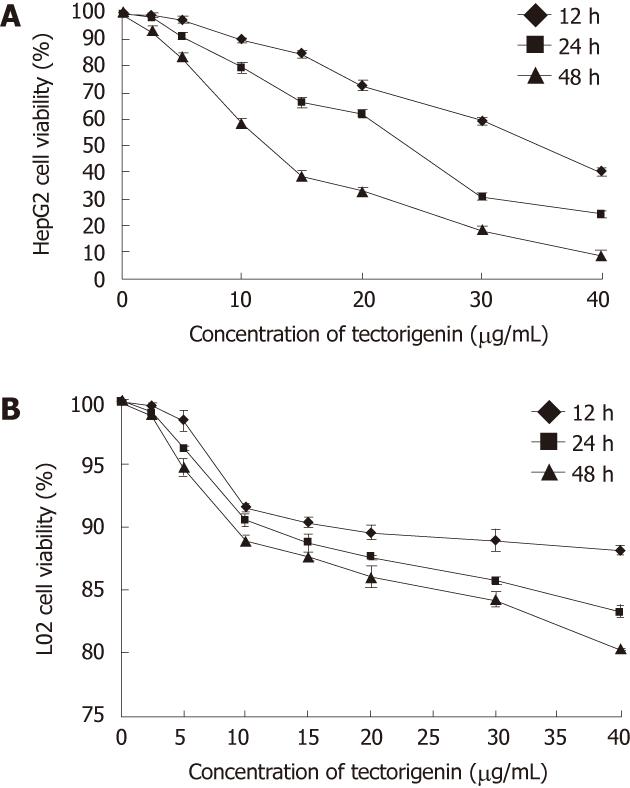
Figure 2 Effects of tectorigenin on the viability of HepG2 (A) and L02 cells (B).
Cells were treated for 12, 24 and 48 h with tectorigenin at 2.5, 5, 10, 15, 20, 30 and 40 mg/L, respectively, followed by assessing the cell viability relative to that of untreated cells (control). Bars represent mean ± SD.
Figure 3 Morphological changes of HepG2 cells after exposure to tectorigenin.
HepG2 cells were treated with vehicle (A) and tectorigenin at 5 (B), 10 (C), 20 (D) mg/L for 48 h, the cells were then fixed and stained with Hoechst 33258 and observed under a fluorescent microscope (Leica DM IRB) (Magnification × 400). Tectorigenin significantly induced condensed chromatin and fragmented nuclei. The arrows in B-D indicate cells undergoing apoptosis.
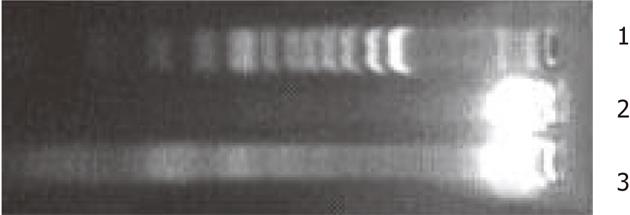
Figure 4 DNA fragmentation of HepG2 cells induced by tectorigenin.
Cells were treated with tectorigenin at 20 mg/L for 48 h, then total DNA was isolated as described in Methods and analyzed by eletrophoresis for detection of DNA fragmentation. 1: Marker; 2: Control; 3: Tectorigenin.
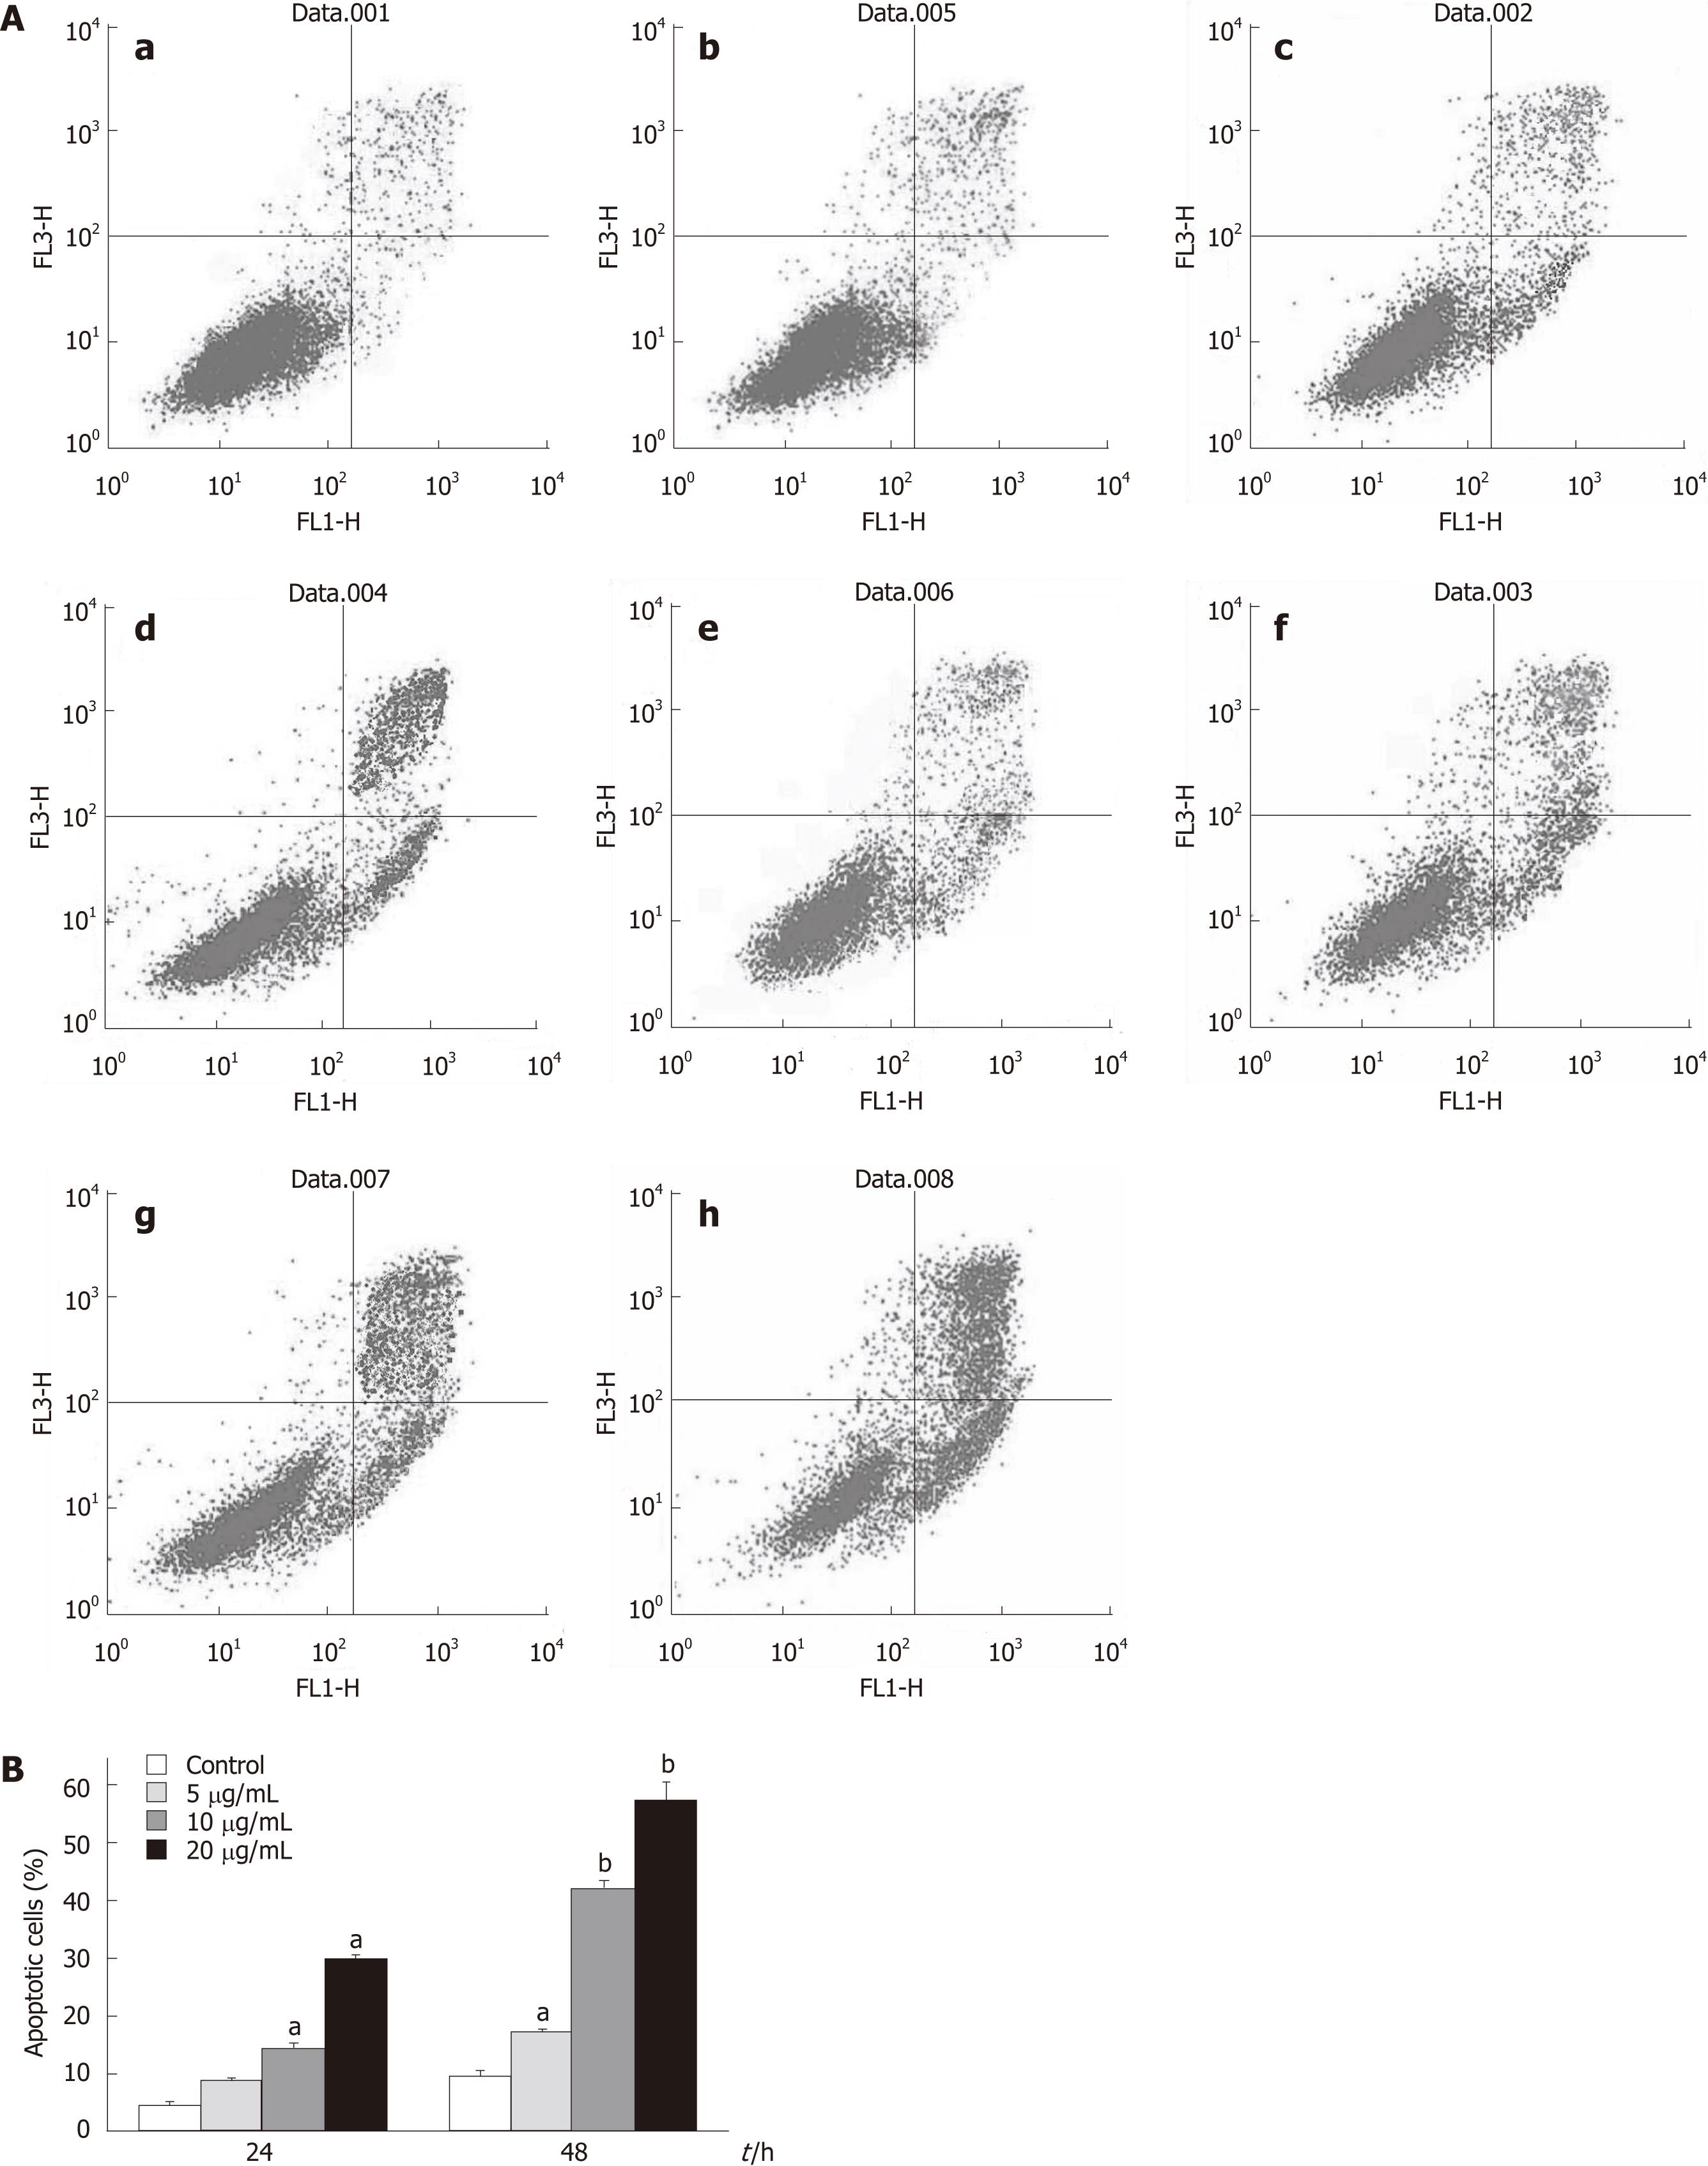
Figure 5 Flow cytometric analysis of apoptosis in HepG2 cells treated with tectorigenin.
HepG2 cells were incubated for 24 and 48 h with tectorigenin at 0, 5, 10, 20 mg/L, respectively. And then the cells were stained with EGFP-conjugated Annexin V and propidium iodide (PI). The EGFP and PI fluorescence was measured using flow cytometer with FL1 and FL3 filters, respectively. A: Representative dot plots of Annexin V/PI staining. a: Control, 24 h; b: 5 mg/L, 24 h; c: 10 mg/L, 24 h; d: 20 mg/L, 24 h; e: Control, 48h; f: 5 mg/L, 48 h; g: 10 mg/L, 48 h; h: 20 mg/L, 48 h. The lower left quadrant contains the vital (double negative) population. The lower right quadrant contains the early apoptotic (Annexin V+/PI-) population and upper right quadrant contains the late apoptotic/necrotic (Annexin V+/PI+) population; B: Data pooled from three independent experiments show the percentage of apoptotic cells. Difference was considered statistically significant when aP < 0.05 and bP < 0.01 vs control.
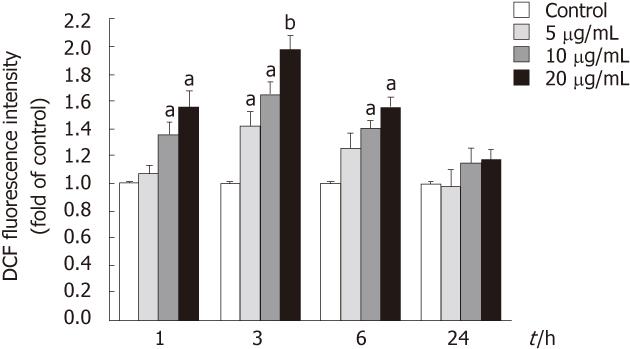
Figure 6 Stimulation by tectorigenin of reactive oxygen species generation in HepG2 cells.
Reactive oxygen species was measured using an oxidation-sensitive fluorescent probe, DCFH-DA. Cells were treated with tectorigenin for 1, 3, 6 and 24 h, and then incubated for 30 min with DCFH-DA at 37 °C. After washing with phosphate buffered saline, the fluorescence intensity of the cells was analyzed with a fluorescence plate reader. Data are expressed as the mean of three individual experiments ± SD. Difference was considered statistically significant when aP < 0.05 and bP < 0.01 vs control. DCF: Dichlorodihydrofluorescein.
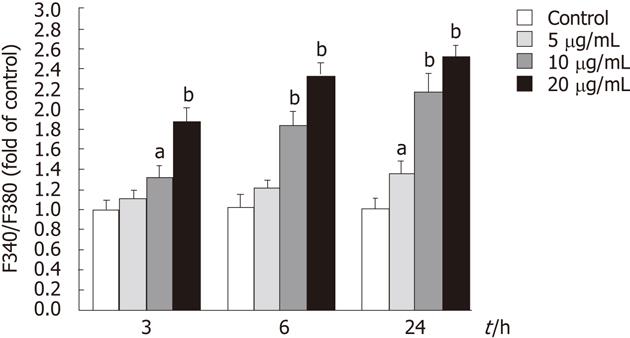
Figure 7 Effects of tectorigenin on the increase of intracellular Ca2+ in HepG2 cells.
Cells were treated with tectorigenin at 5, 10 or 20 mg/L for different time points, and then loaded with Fura 2-acetoxymethy ester. Intracellular Ca2+ was measured by fluorescence analysis. The data were presented as mean ± SD (n = 6). Difference was considered statistically significant when aP < 0.05 and bP < 0.01 vs control.
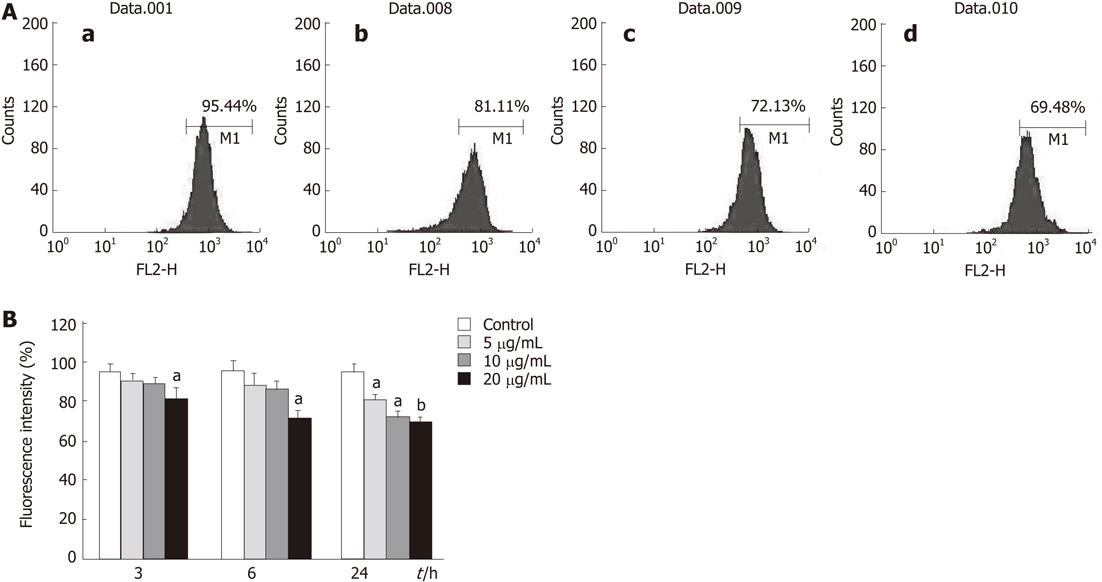
Figure 8 Effects of tectorigenin on integrity of mitochondrial membrane in HepG2 cells.
Cells were treated with tectorigenin for different time points, then incubated with Rhodamine 123 and analyzed by flow cytometry. A: HepG2 cells were treated with 0 (a), 5 (b), 10 (c) and 20 (d) mg/L tectorigenin for 24 h. Mitochondrial membrane potential was measured by Rh123, a fluorescent probe, on FACSCalibur at FL2 channel with an excitation wavelength of 488 nm. Each test was performed 3 times and images presented were typical of 3 independent experiments; B: The data were presented as mean ± SD (n = 3). Difference was considered statistically significant when aP < 0.05 and bP < 0.01 vs control.
Figure 9 Western blotting analysis.
After 48-h exposure to tectorigenin at 0, 5, 10 and 20 mg/L, respectively, levels of cytochrome c in HepG2 cells (A), along with those of cytochrome c (B) in cytosol, were evaluated. Protein (50 μg) from each sample was resolved on 12% sodium dodecyl sulfate polyacrylamide gel electrophoresis and β-actin was used as a loading control.
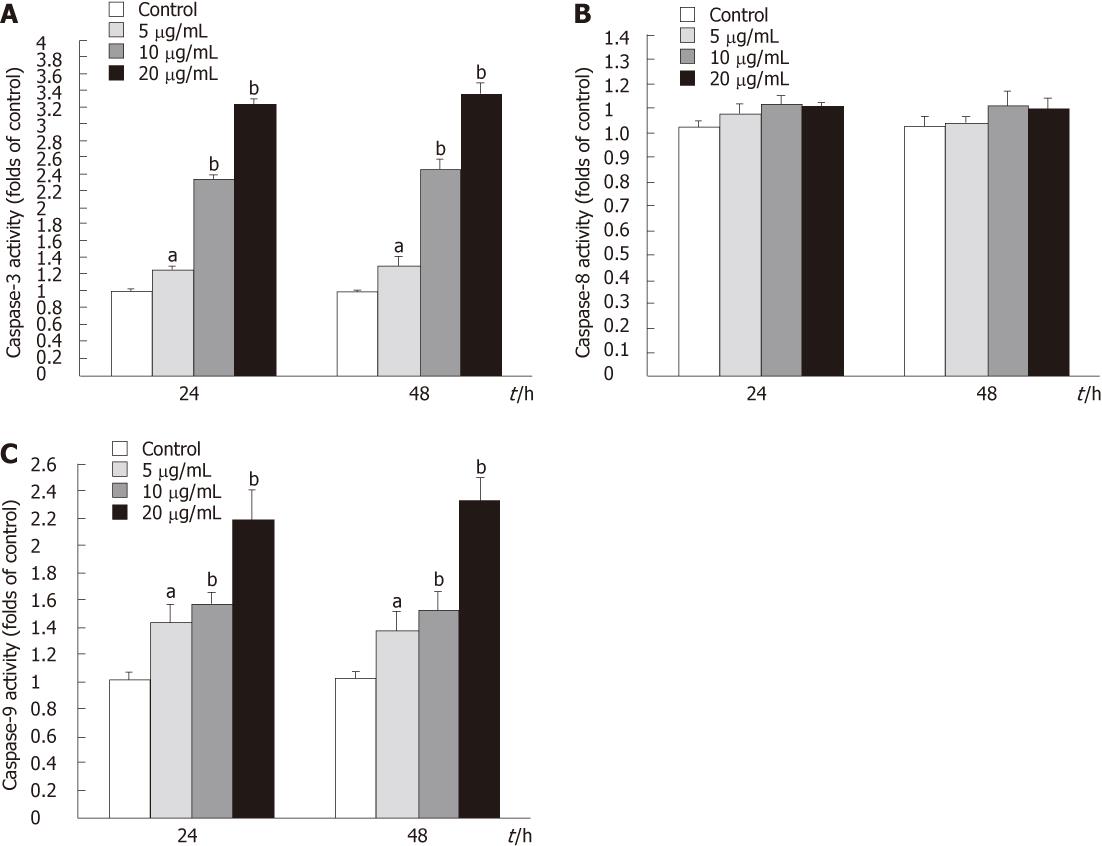
Figure 10 Caspase activities in tectorigenin-treated HepG2 cells.
Cells were treated with tectorigenin at the indicated concentrations for 24 and 48 h. Cytosolic extracts were prepared and assayed for caspase activities as described in “Materials and Methods”. A: Alteration of caspase-3 activity in tectorigenin-induced HepG2 cells for indicated time; B: Effect of tectorigein on caspase-8 activity in HepG2 cells; C: Changes of caspase-9 activity in tectorigenin-treated HepG2 cells at 5, 10 and 20 mg/L for 24 and 48 h. Data are expressed as the mean of three individual experiments ± SD. Difference was considered statistically significant when aP < 0.05 and bP < 0.01 vs control.
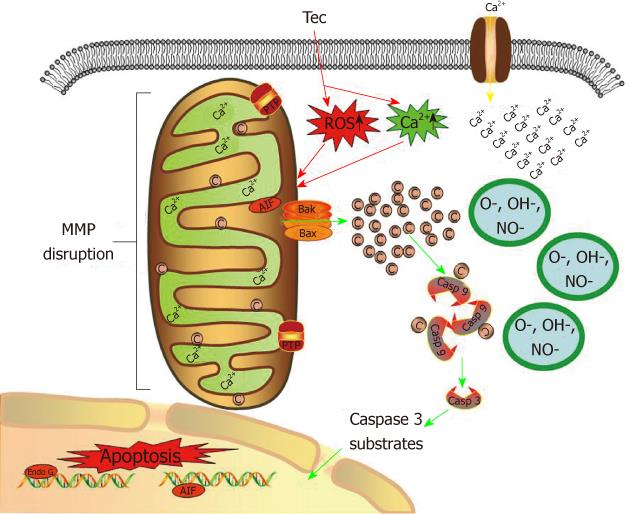
Figure 11 Possible mechanisms by which tectorigenin induces apoptosis in human hepatocellular carcinoma HepG2 cells.
Tectorigenin produces reactive oxygen species and increases Ca2+ concentration in cytoplasm of HepG2 cells, leading to the depletion of mitochondrial membrane potential and release of cytochrome c from mitochondria. Cytochrome c facilitates apoptosis of HepG2 cells by activating caspase cascade. Tec: Tectorigenin; ROS: Reactive oxygen species; C: Cytochrome c; Casp: Caspase; AIF: Apoptosis inducing factor; MMP: Mitochondrial membrane potential.
- Citation: Jiang CP, Ding H, Shi DH, Wang YR, Li EG, Wu JH. Pro-apoptotic effects of tectorigenin on human hepatocellular carcinoma HepG2 cells. World J Gastroenterol 2012; 18(15): 1753-1764
- URL: https://www.wjgnet.com/1007-9327/full/v18/i15/1753.htm
- DOI: https://dx.doi.org/10.3748/wjg.v18.i15.1753


