Copyright
©2012 Baishideng Publishing Group Co.
World J Gastroenterol. Apr 21, 2012; 18(15): 1753-1764
Published online Apr 21, 2012. doi: 10.3748/wjg.v18.i15.1753
Published online Apr 21, 2012. doi: 10.3748/wjg.v18.i15.1753
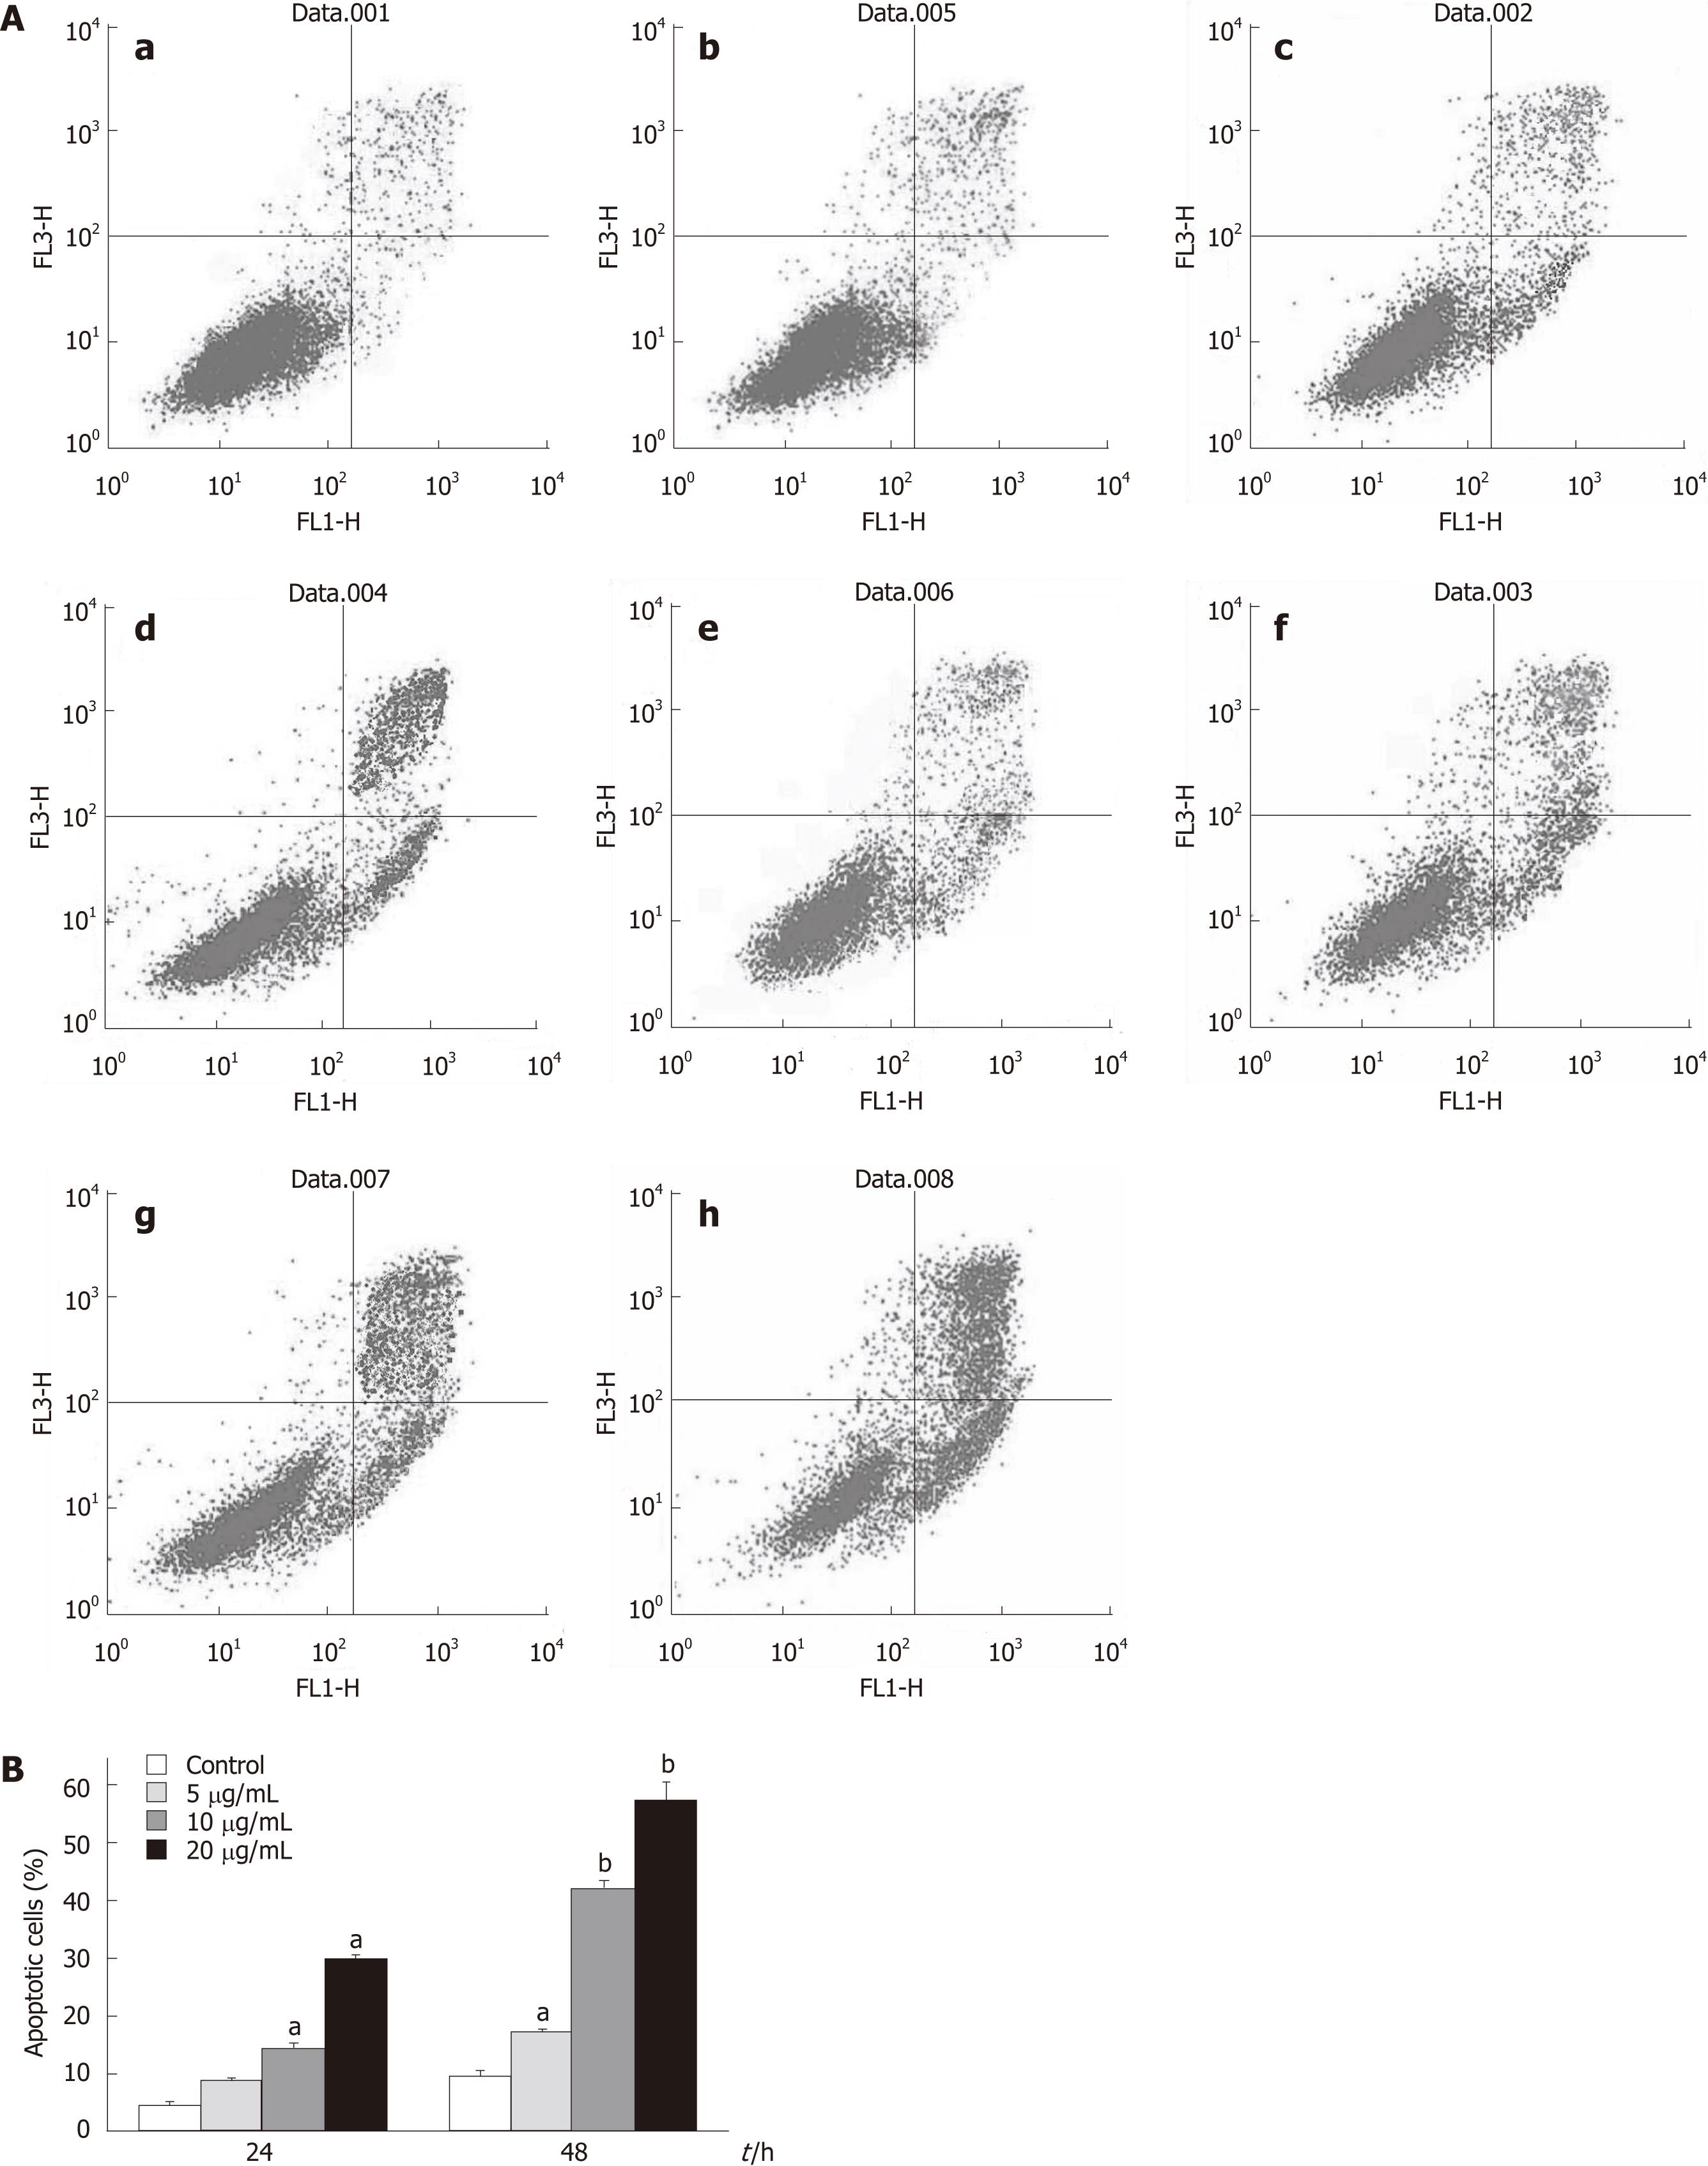
Figure 5 Flow cytometric analysis of apoptosis in HepG2 cells treated with tectorigenin.
HepG2 cells were incubated for 24 and 48 h with tectorigenin at 0, 5, 10, 20 mg/L, respectively. And then the cells were stained with EGFP-conjugated Annexin V and propidium iodide (PI). The EGFP and PI fluorescence was measured using flow cytometer with FL1 and FL3 filters, respectively. A: Representative dot plots of Annexin V/PI staining. a: Control, 24 h; b: 5 mg/L, 24 h; c: 10 mg/L, 24 h; d: 20 mg/L, 24 h; e: Control, 48h; f: 5 mg/L, 48 h; g: 10 mg/L, 48 h; h: 20 mg/L, 48 h. The lower left quadrant contains the vital (double negative) population. The lower right quadrant contains the early apoptotic (Annexin V+/PI-) population and upper right quadrant contains the late apoptotic/necrotic (Annexin V+/PI+) population; B: Data pooled from three independent experiments show the percentage of apoptotic cells. Difference was considered statistically significant when aP < 0.05 and bP < 0.01 vs control.
- Citation: Jiang CP, Ding H, Shi DH, Wang YR, Li EG, Wu JH. Pro-apoptotic effects of tectorigenin on human hepatocellular carcinoma HepG2 cells. World J Gastroenterol 2012; 18(15): 1753-1764
- URL: https://www.wjgnet.com/1007-9327/full/v18/i15/1753.htm
- DOI: https://dx.doi.org/10.3748/wjg.v18.i15.1753


